


We're very grateful for the abundance of ideas our Customer Community has contributed this year which have resulted in released product features, thank you for your continued feedback and innovation. To end 2025 with a bang, we've released the highly requested PowerPoint add-in and several other nifty features to power your planning.
- 📏 Introducing Pigment Feature Spotlights
- 👁️🗨️ Insert Pigment Views into PowerPoint
- 🗺️ Visualize areas and markers in one map
- 🛠️ Iterate your Analyst Agent reports
- ⌛ Import Snapshot data into Metrics
- 💫 Simplify version comparisons with Data Slices
- 🔐 Role permissions fully deployable in T&D
- ⏱️ Predict with the power of Chronos-2
- 🔎 View and monitor Workspace storage
- ✏️ Pigment is named a Visionary in 2025 Gartner® Magic Quadrant™
Introducing Pigment Feature Spotlights
Introducing Pigment Feature Spotlights—short, dynamic 3–8 minute videos that help you quickly learn and master key Pigment features. Each bite-sized lesson goes straight to the value, showing exactly how to use our latest capabilities. Start exploring the first three sets today: Analyst Agent (including French versions), MCP Server, and Data Slices.
Insert Pigment Views into PowerPoint
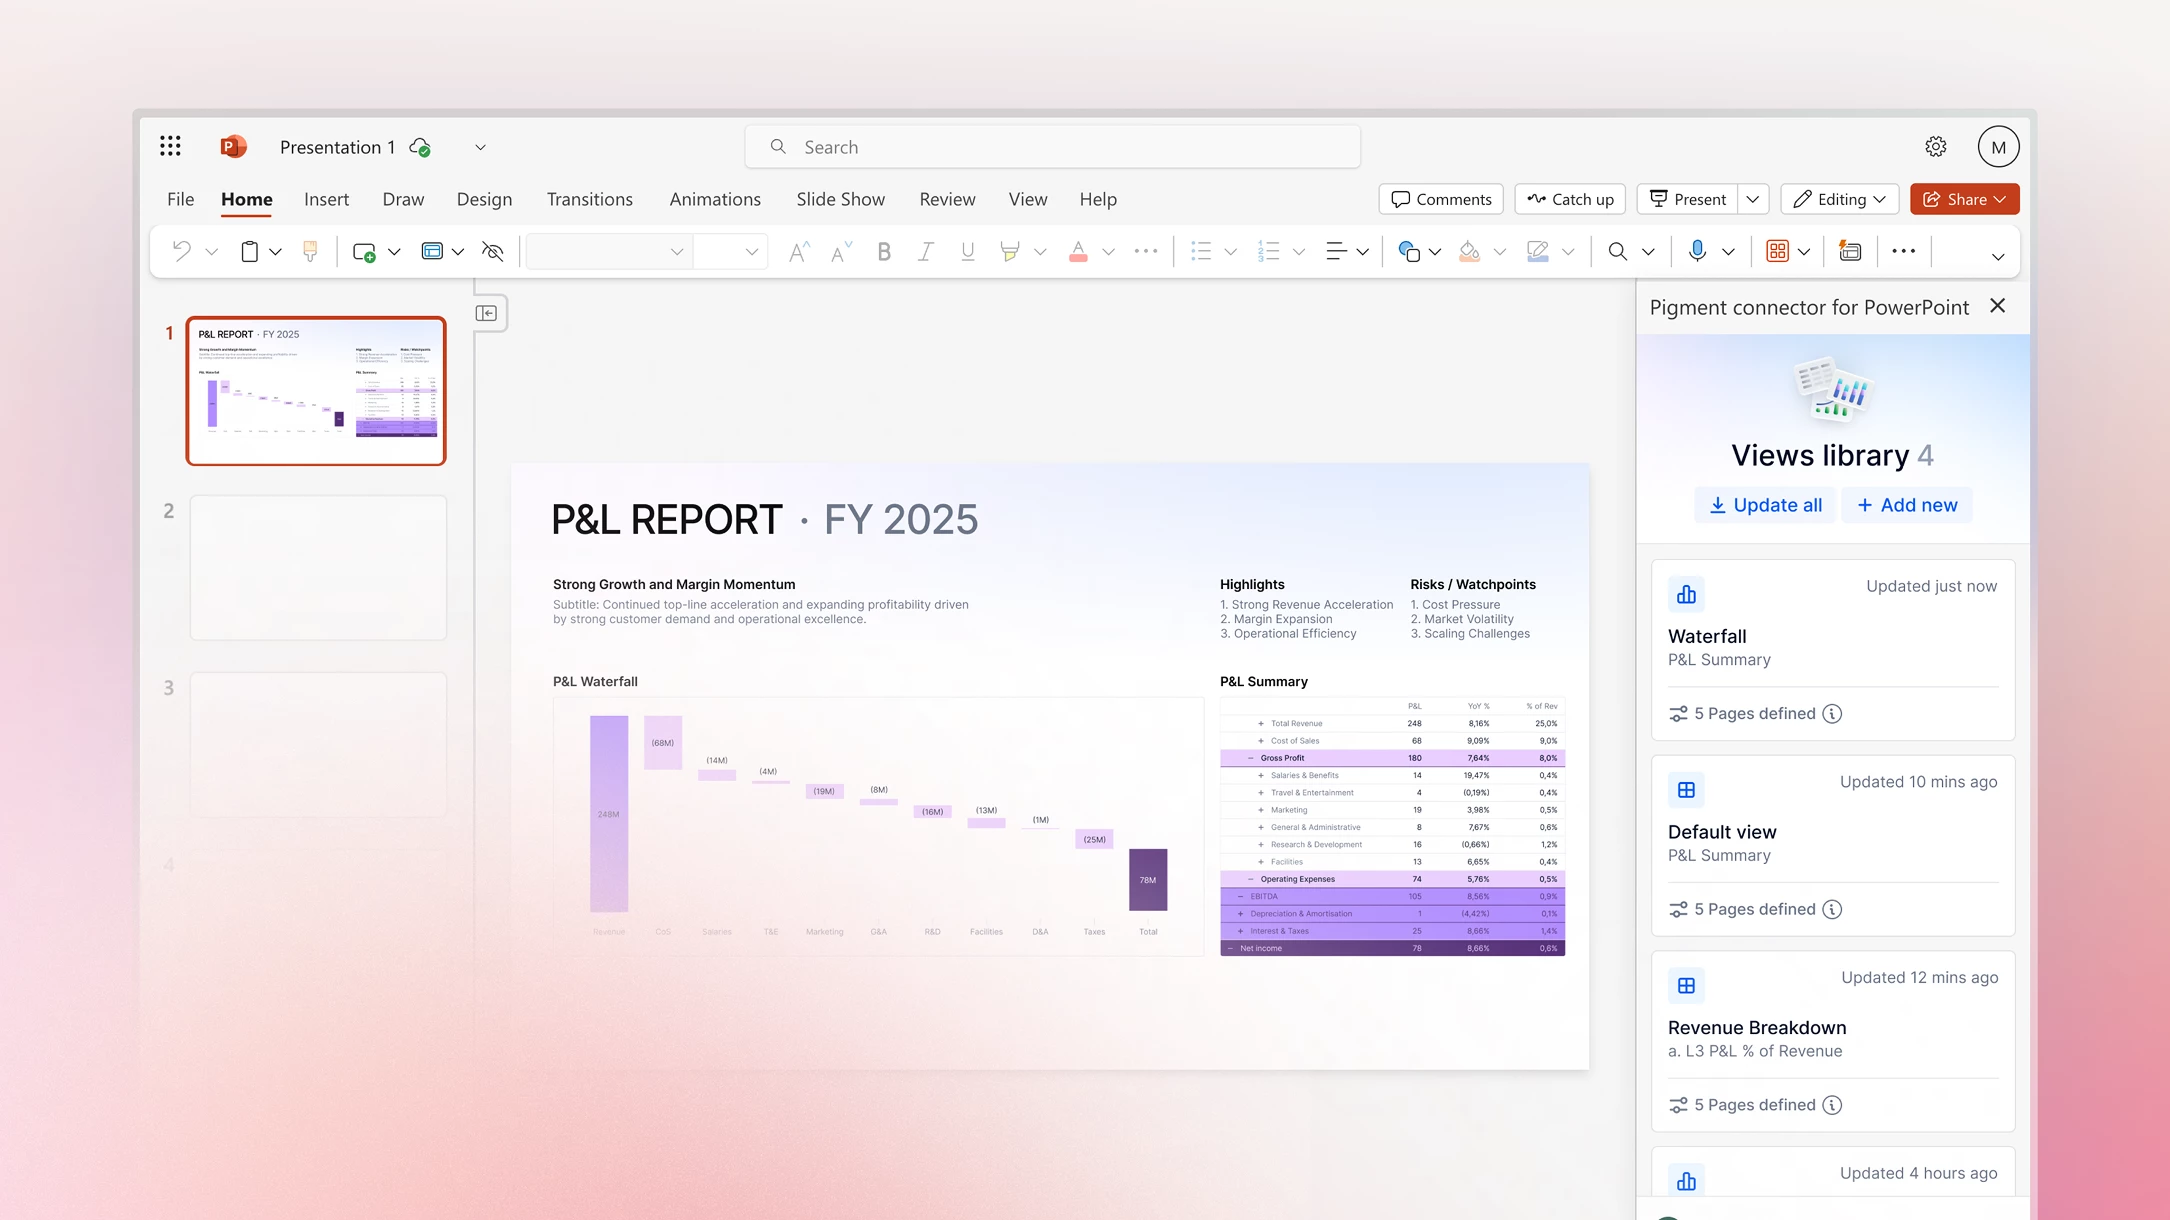
With the new Pigment Connector for PowerPoint Add-in, you can seamlessly insert Pigment charts and grids into slides while preserving formatting and maintaining live data connections. Refresh a single View or an entire deck in one click to keep numbers accurate as data changes. Bring real-time Pigment insights into every presentation—now available on the Microsoft App Marketplace. Learn more.
Visualize areas and markers in one map
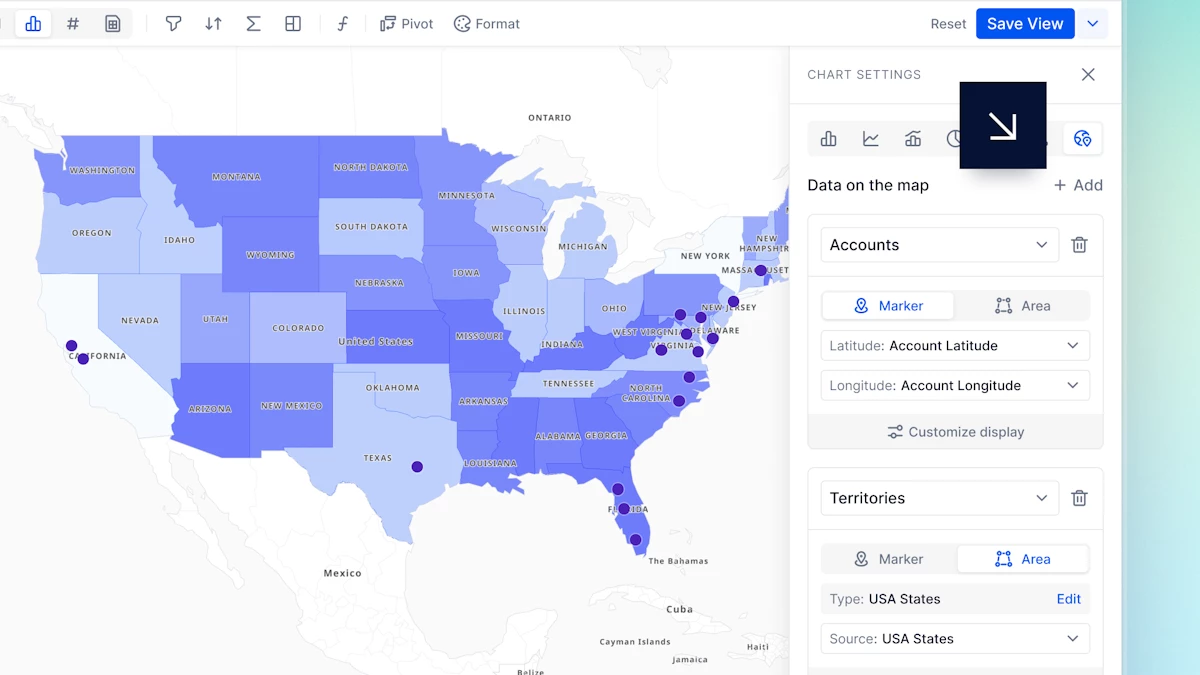
Multi-layer Map charts are now live, making it easy to combine markers and areas in a single View for richer geographic insight. You can overlay multiple datasets or geographic layers, such as sales territories with account markers, and customize each layer’s colors, Metrics, and display options to visualize relationships clearly in one place. Learn more.
Iterate your Analyst Agent reports
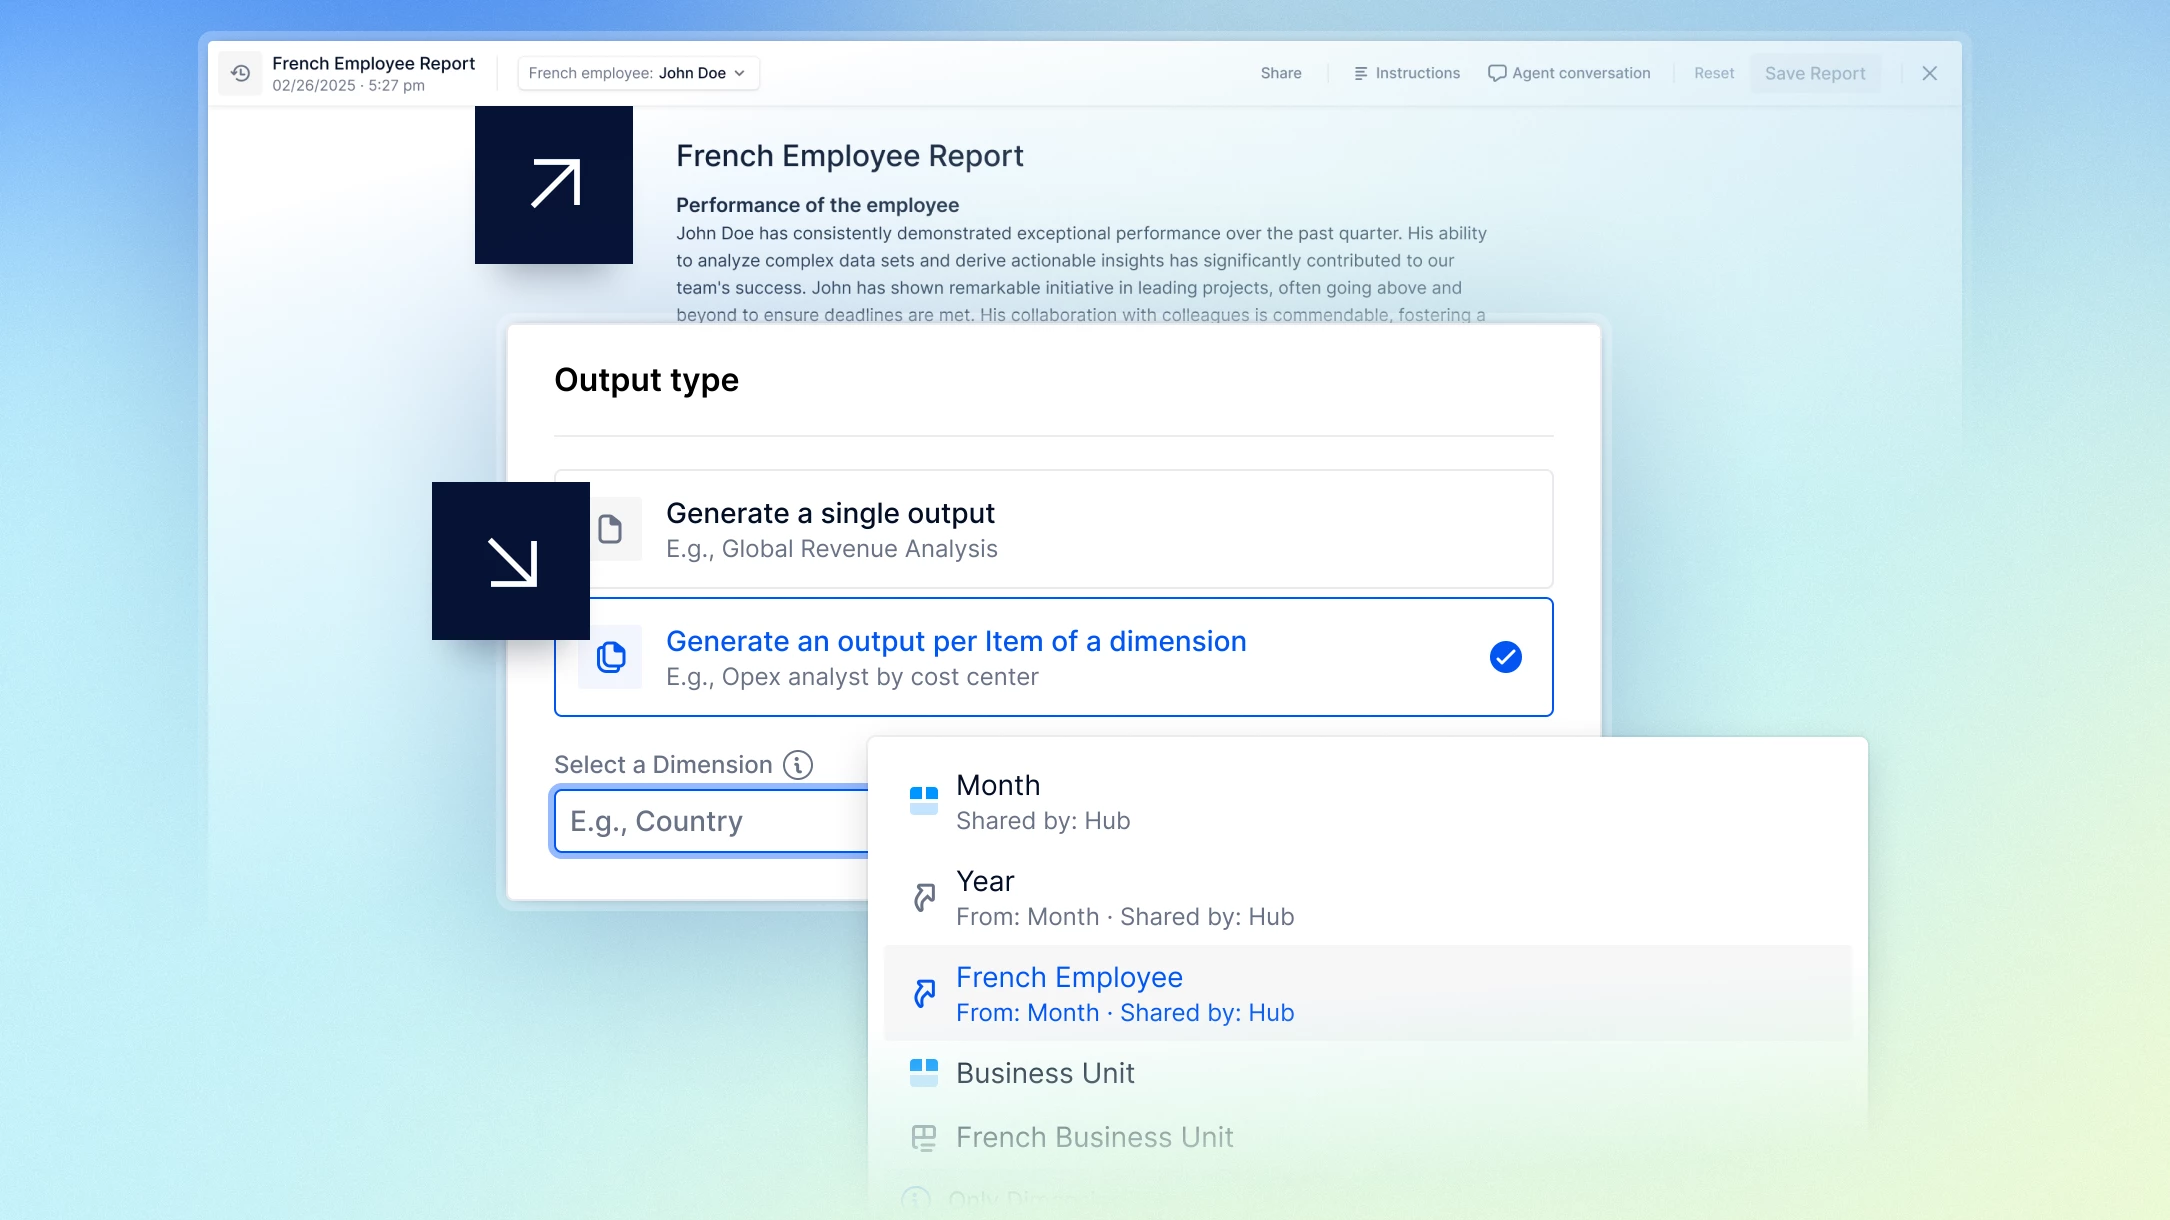
You can now set up your Analyst Agent Mission to run Multi-Reports! With this feature, your reports iterate over the Items of a single Dimension. Think: one report per month, per product category, per country — all in one run. Ideal for producing consistent analyses across segments without rewriting prompts or duplicating configurations! Learn more.
Import Snapshot data into Metrics
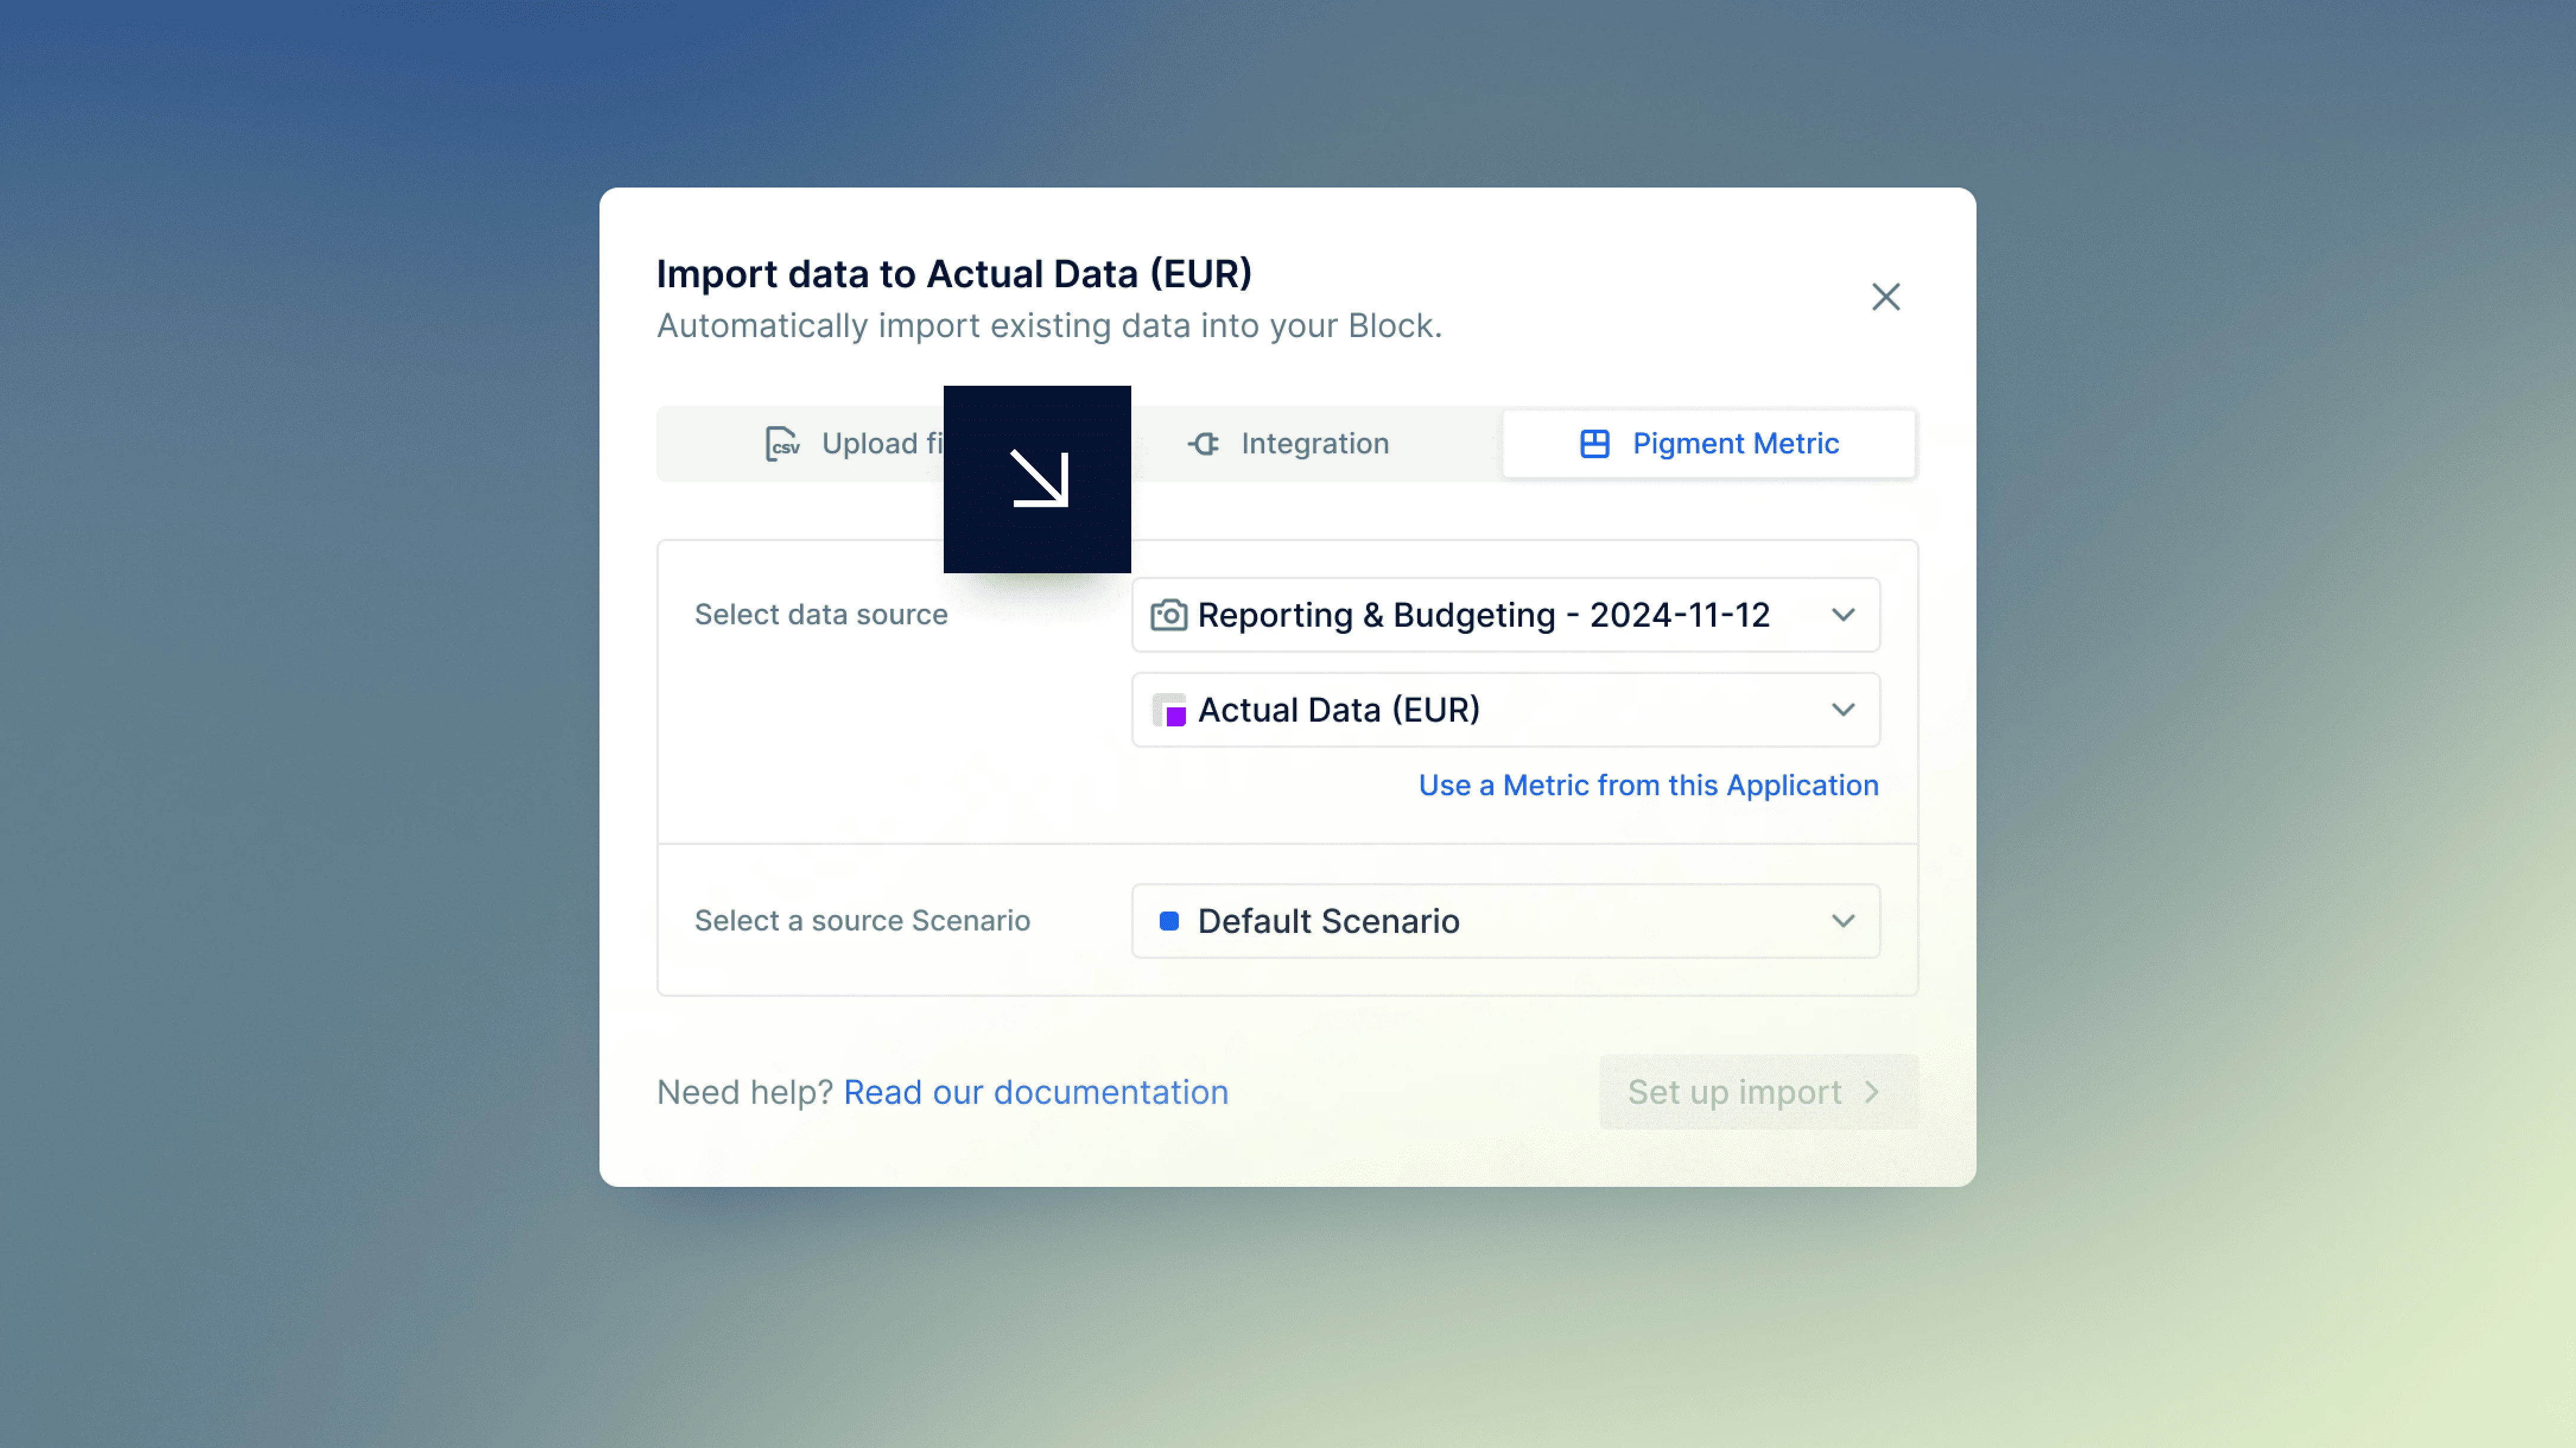
You can now import Snapshot data directly into Metrics that share the same Dimensions and data type. Compatible Metrics automatically appear as selectable sources during import. If some Dimension Items no longer match, you can choose to fail the import or reject only affected rows, enabling better version management and use of historical data when working with evolving data structures. Learn more.
Simplify version comparisons with Data Slices
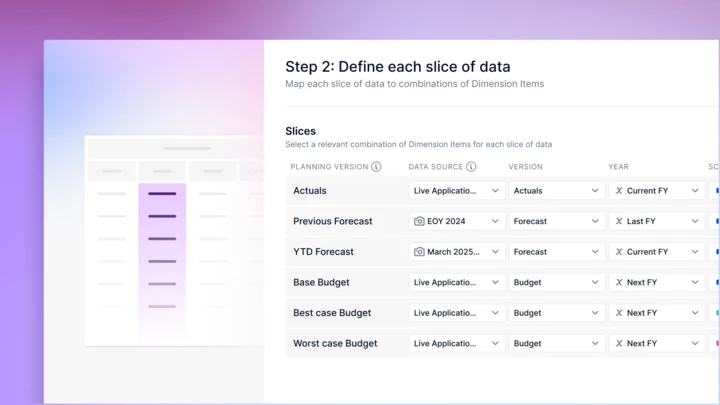
With Data Slices, you can compare only the data you need without juggling multiple selectors. Each Slice represents a meaningful combination of Items, like Actuals 2025, and simplifies multi-Dimension version management for users. Add Slices to any View directly from the Pivot panel to streamline your analysis. Learn more.
Role permissions fully deployable in T&D
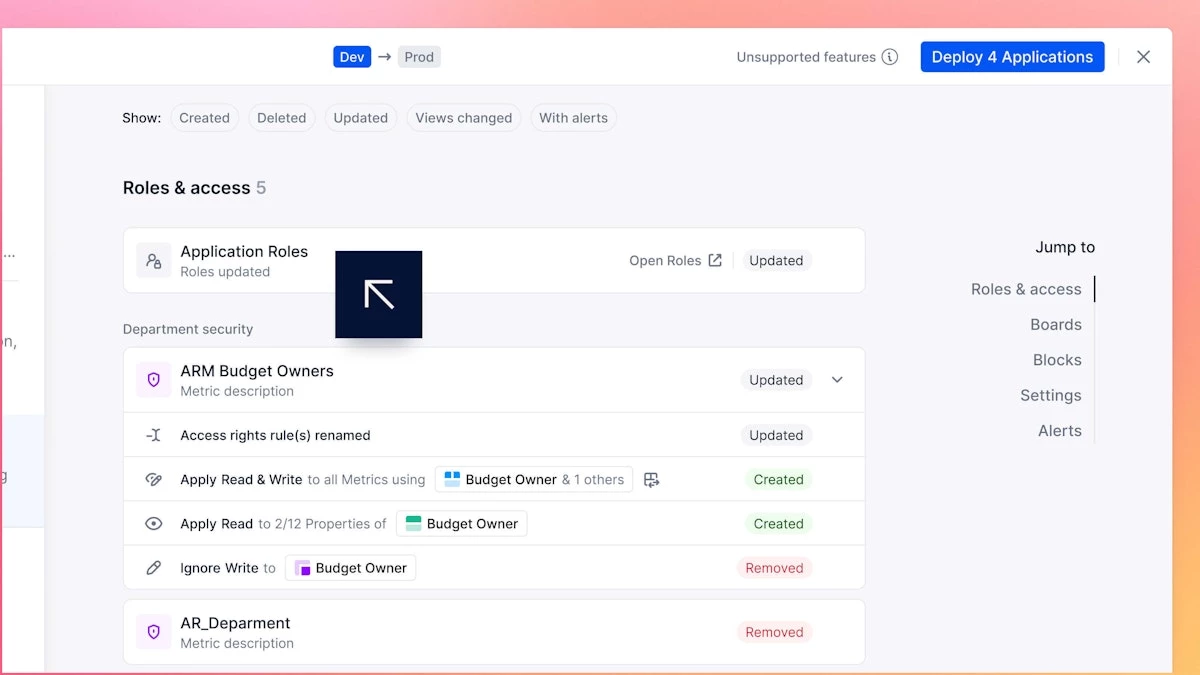
Role permissions now fully deploy through Test & Deploy. All Role settings, including List permissions and custom Property data, sync across environments. You can still edit locally, but Development updates override others, ensuring greater consistency and control across environments.
Learn more.
Predict with the power of Chronos-2

You can now choose Chronos-2 for your Predictions! Chronos-2 consistently outperforms our other models across all calendar granularities and works effectively with or without covariates. It was pretrained on a massive corpus of time series data, enabling it to generalize well even when your data is sparse, incomplete or noisy. With minimal configuration needed, try out Chronos-2 now! Learn more.
View and monitor Workspace storage
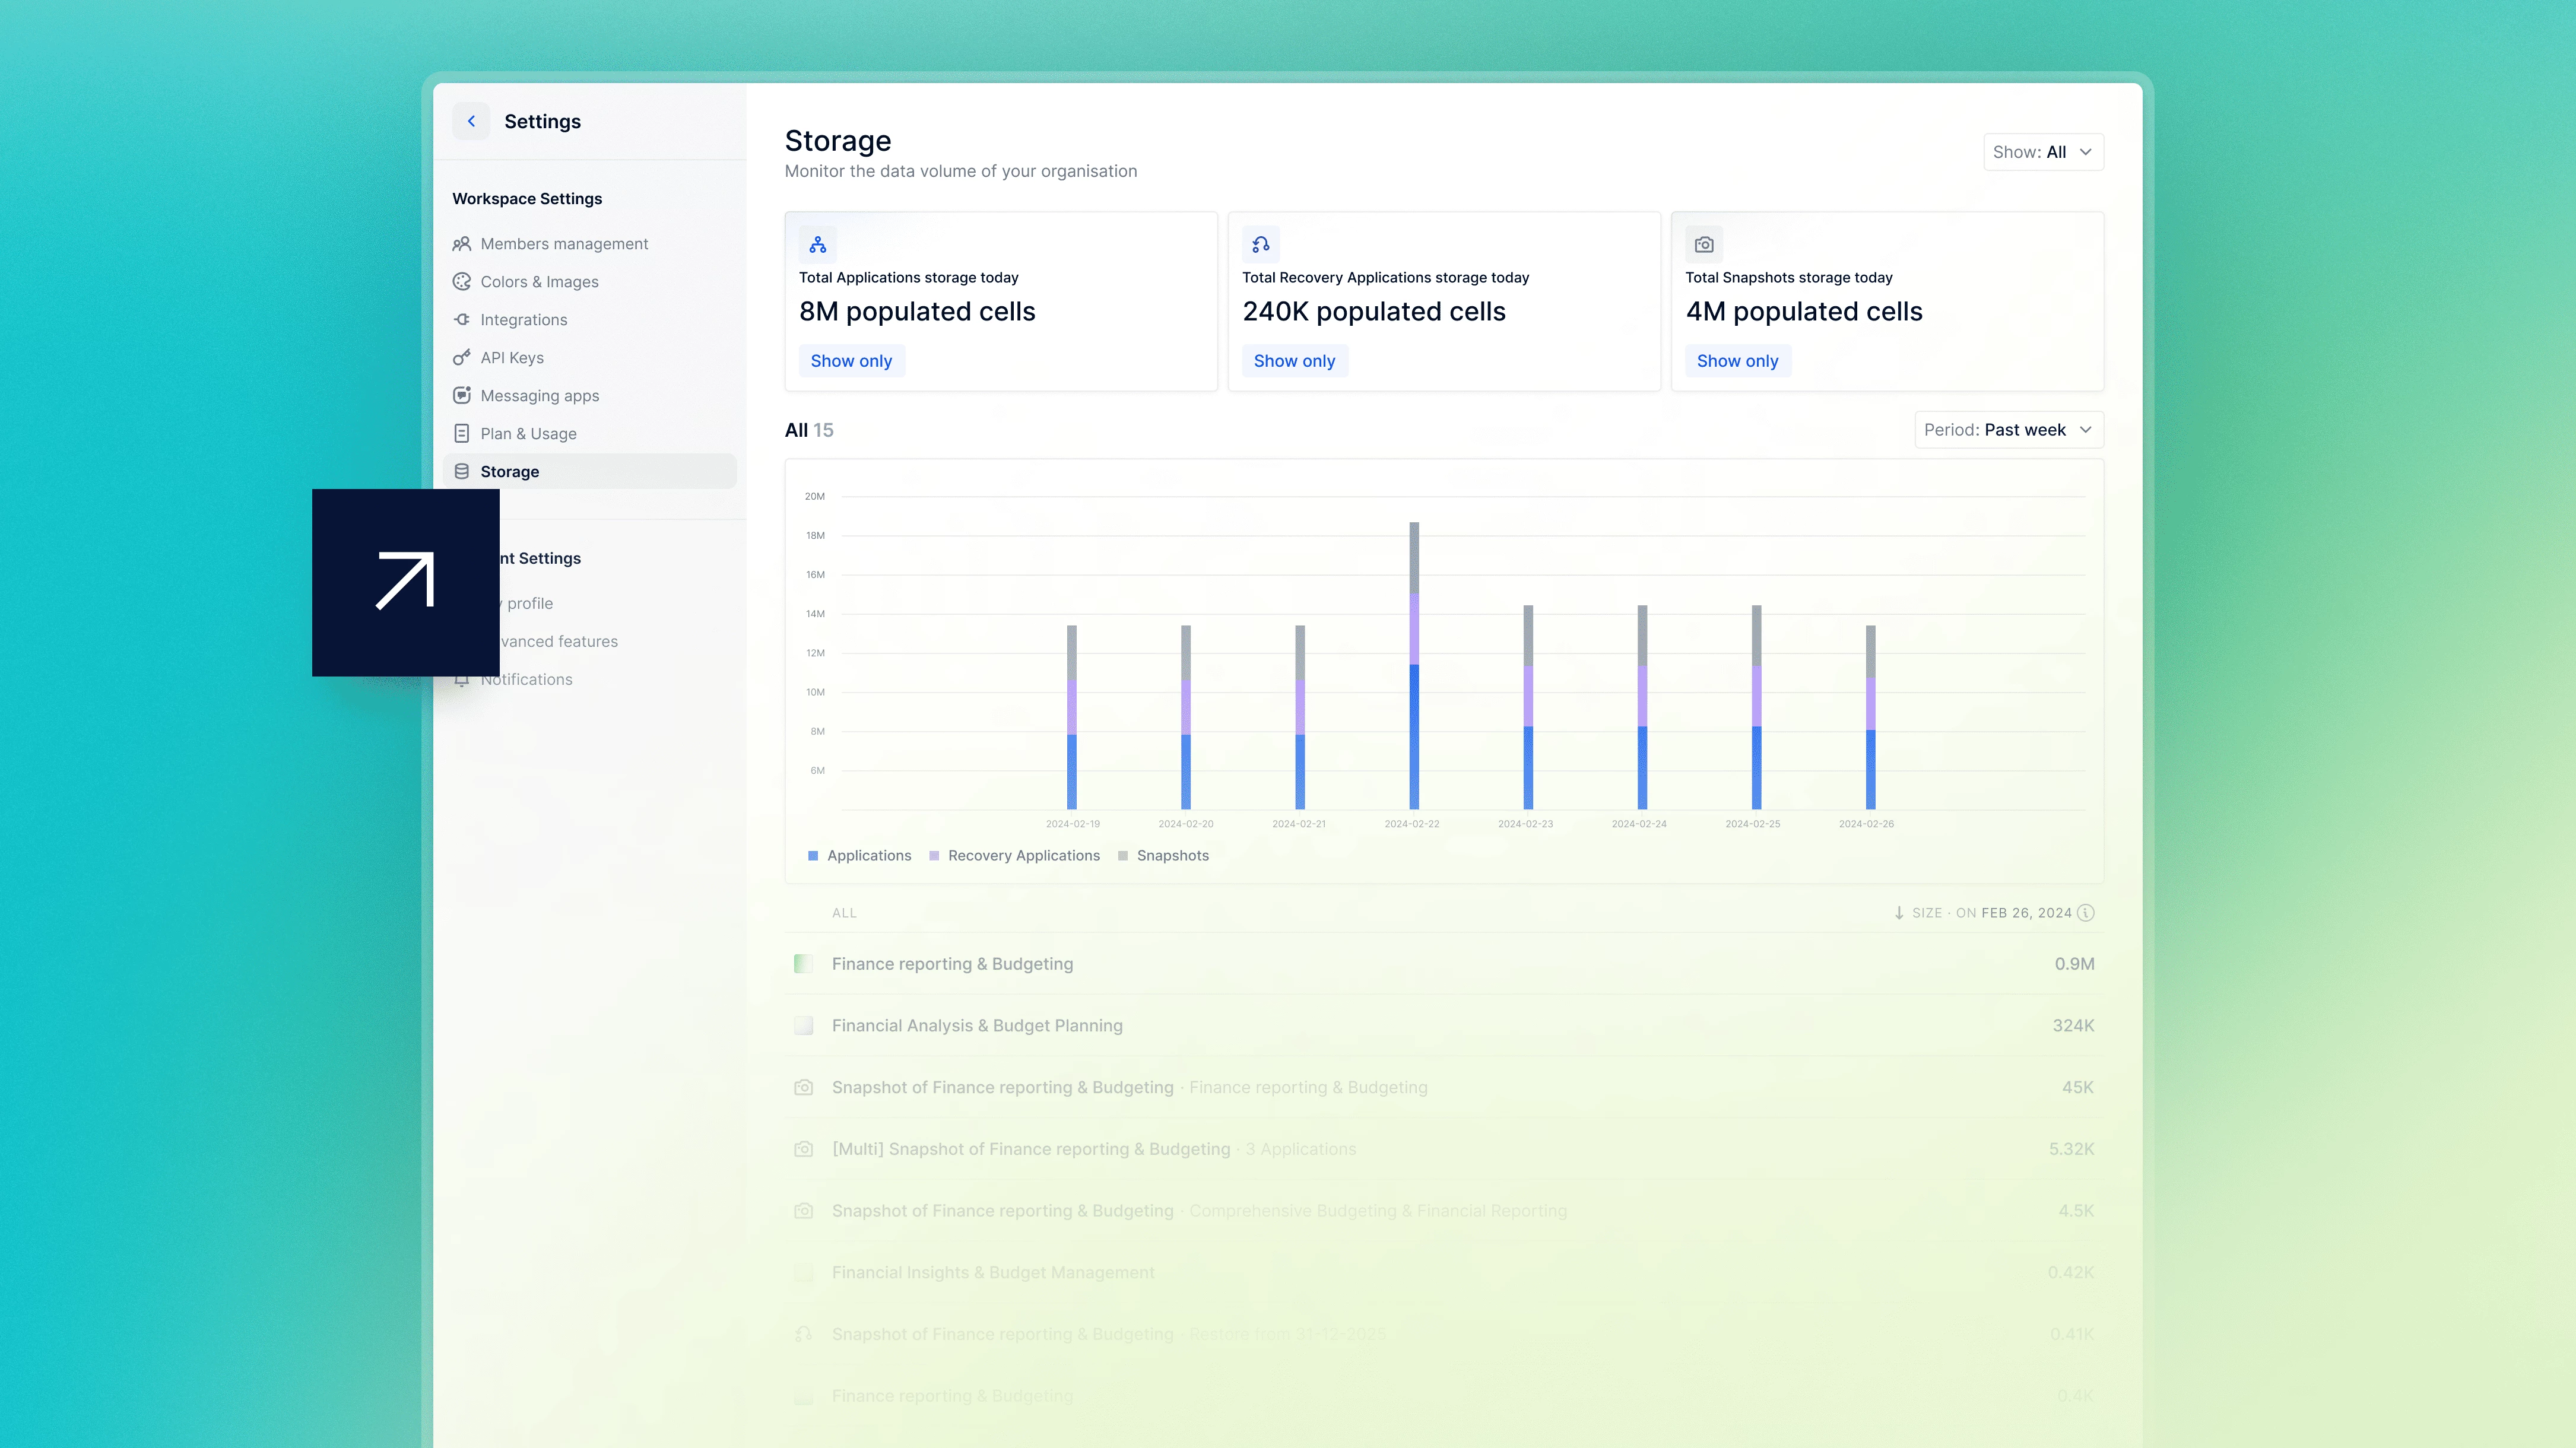
You can now leverage a consolidated, real-time view of populated cell volume across all Applications, Recovered Applications, and Snapshots using the Storage page. Quickly monitor storage trends, spot unexpected increases, and understand where usage is concentrated. It’s a faster, clearer way to maintain healthy Workspace hygiene and support more informed modeling decisions.
Learn more.
Community end of year celebration!

We’re excited to announce our top community users for 2025! In the linked post, you’ll meet nine outstanding winners across three categories. Each has received a special gift and a community badge in recognition of their support, engagement, and impact. Thank you to all for helping our community thrive.
2025 Gartner® Magic Quadrant™ for Financial Planning Software
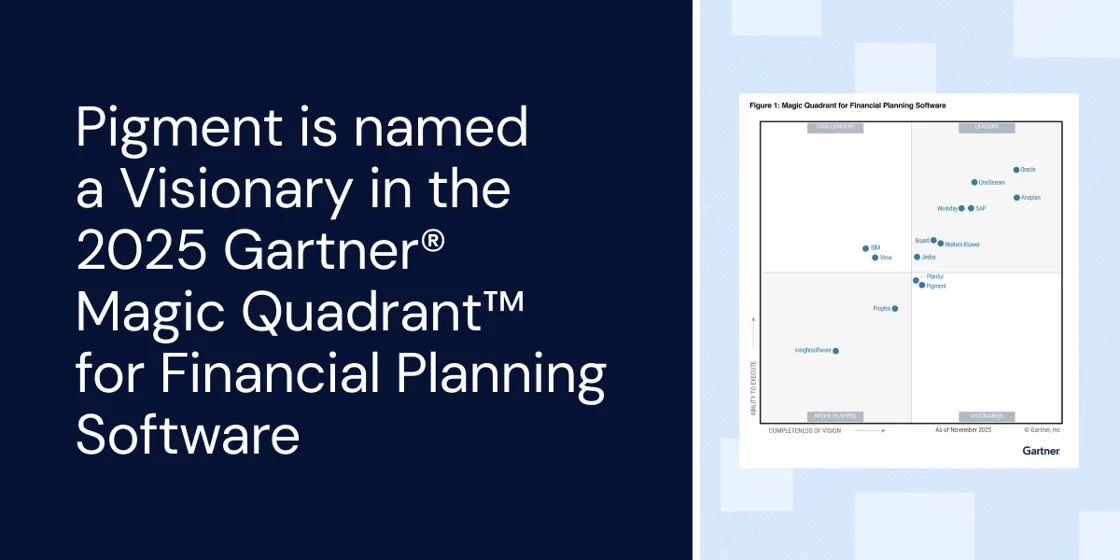
We are thrilled to share that Pigment has again been named a Visionary in the 2025 Gartner® Magic Quadrant™ for Financial Planning Software!
To us, this second inclusion speaks to the momentum behind our product and the AI-first strategy we’re developing with our customers and we're truly grateful for our partnership. Click here to read the report.
We would truly value your perspective in a Gartner Peer Insights review, would you consider writing us a review, please? You can earn up to $50 in gift cards or charity donations in time for Christmas, through our Advocacy Program. Upon login, simply follow the instructions when volunteering to the Gartner Activity.
We're always looking to improve, so please don't be shy and share your comments via email, by contacting your Customer Success Manager, or here on our Community!!
Wishing you and your loved-ones a very happy festive season!