What is the dependency diagram in Pigment and why use it? The dependency diagram displays an overview of a model's structure. It enables you to understand how data flows through a specific Block by showing upstream and downstream Blocks. For those with Define Application security permission, it can show whether Members have access rights for Blocks.
How do you access the dependency diagram?
There are two ways to open the dependency diagram, from the Block Explorer or from Settings in the case of Transaction Lists and Metrics.
From the Block Explorer, select the three dots by the Block you want to explore.
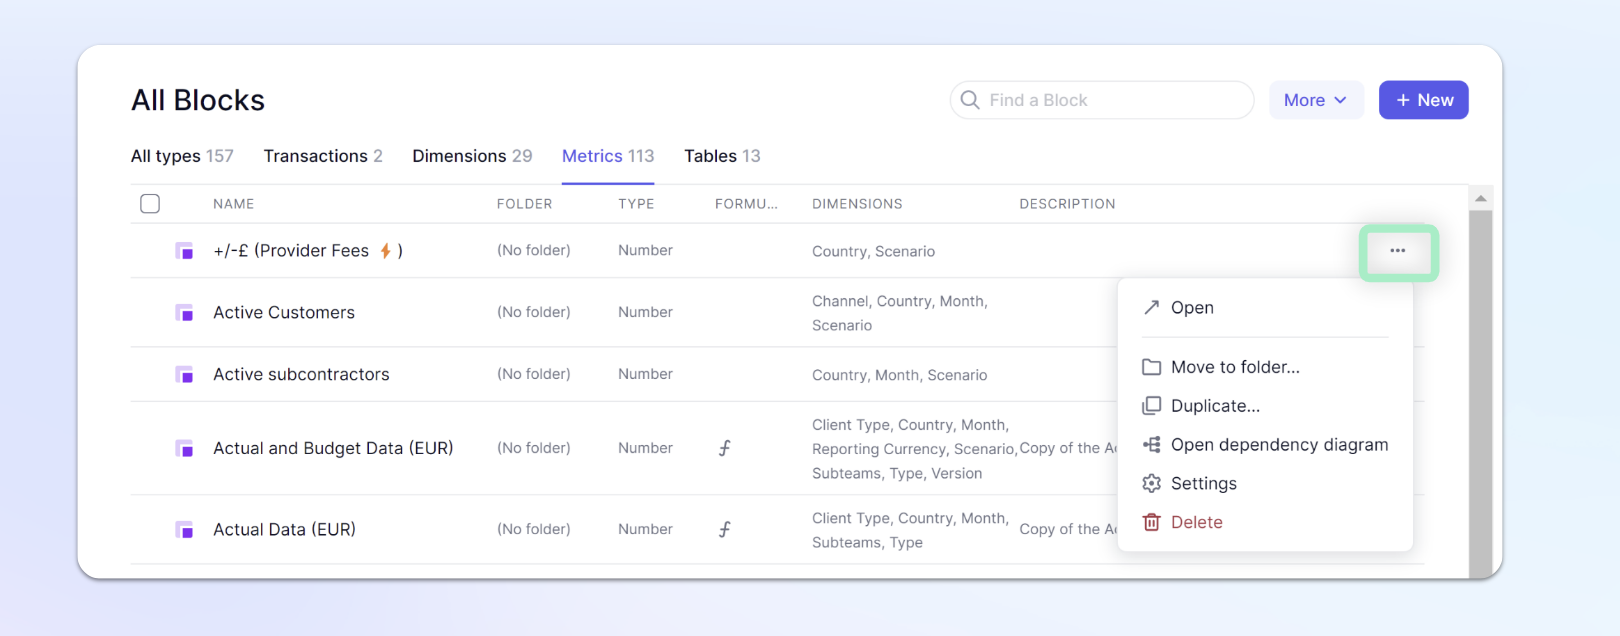
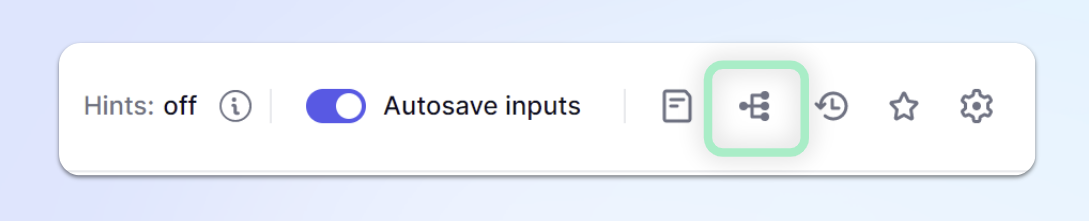
For Transaction Lists and Metrics, access the dependency diagram by selecting the symbol in the top right.
How do you explore the dependency diagram?
The diagram shows how your data flows between Transactional Lists and Metrics. These connections are established through formulas. The data moves from the sources on the left to the targets on the right.
Select Upstream or Downstream beneath the formula bar to filter out downstream or upstream Blocks from your view. You can also pick a Block from the dropdown beside Focus on the path to, to show a subset of your diagram.
Hovering your mouse over a Metric shows you the formula and Dimensions used in the structure. If you hover over a Transaction List, you see all Properties.
Selecting other related Blocks brings up additional functionality:
|

| This button reopens a dependency diagram generated with a new initial Block |
 | This button opens the Block, providing more detail |
The Drag and Drop feature allows you to move the Blocks to reorder them in the way you want.
How do you use the toptip bar?
|

| Zoom in / Zoom out |
|

| Center the diagram on the initial Block |
|

| Fit diagram on the screen |
|

| Reset current diagram |
Turn on Access Rights Mode
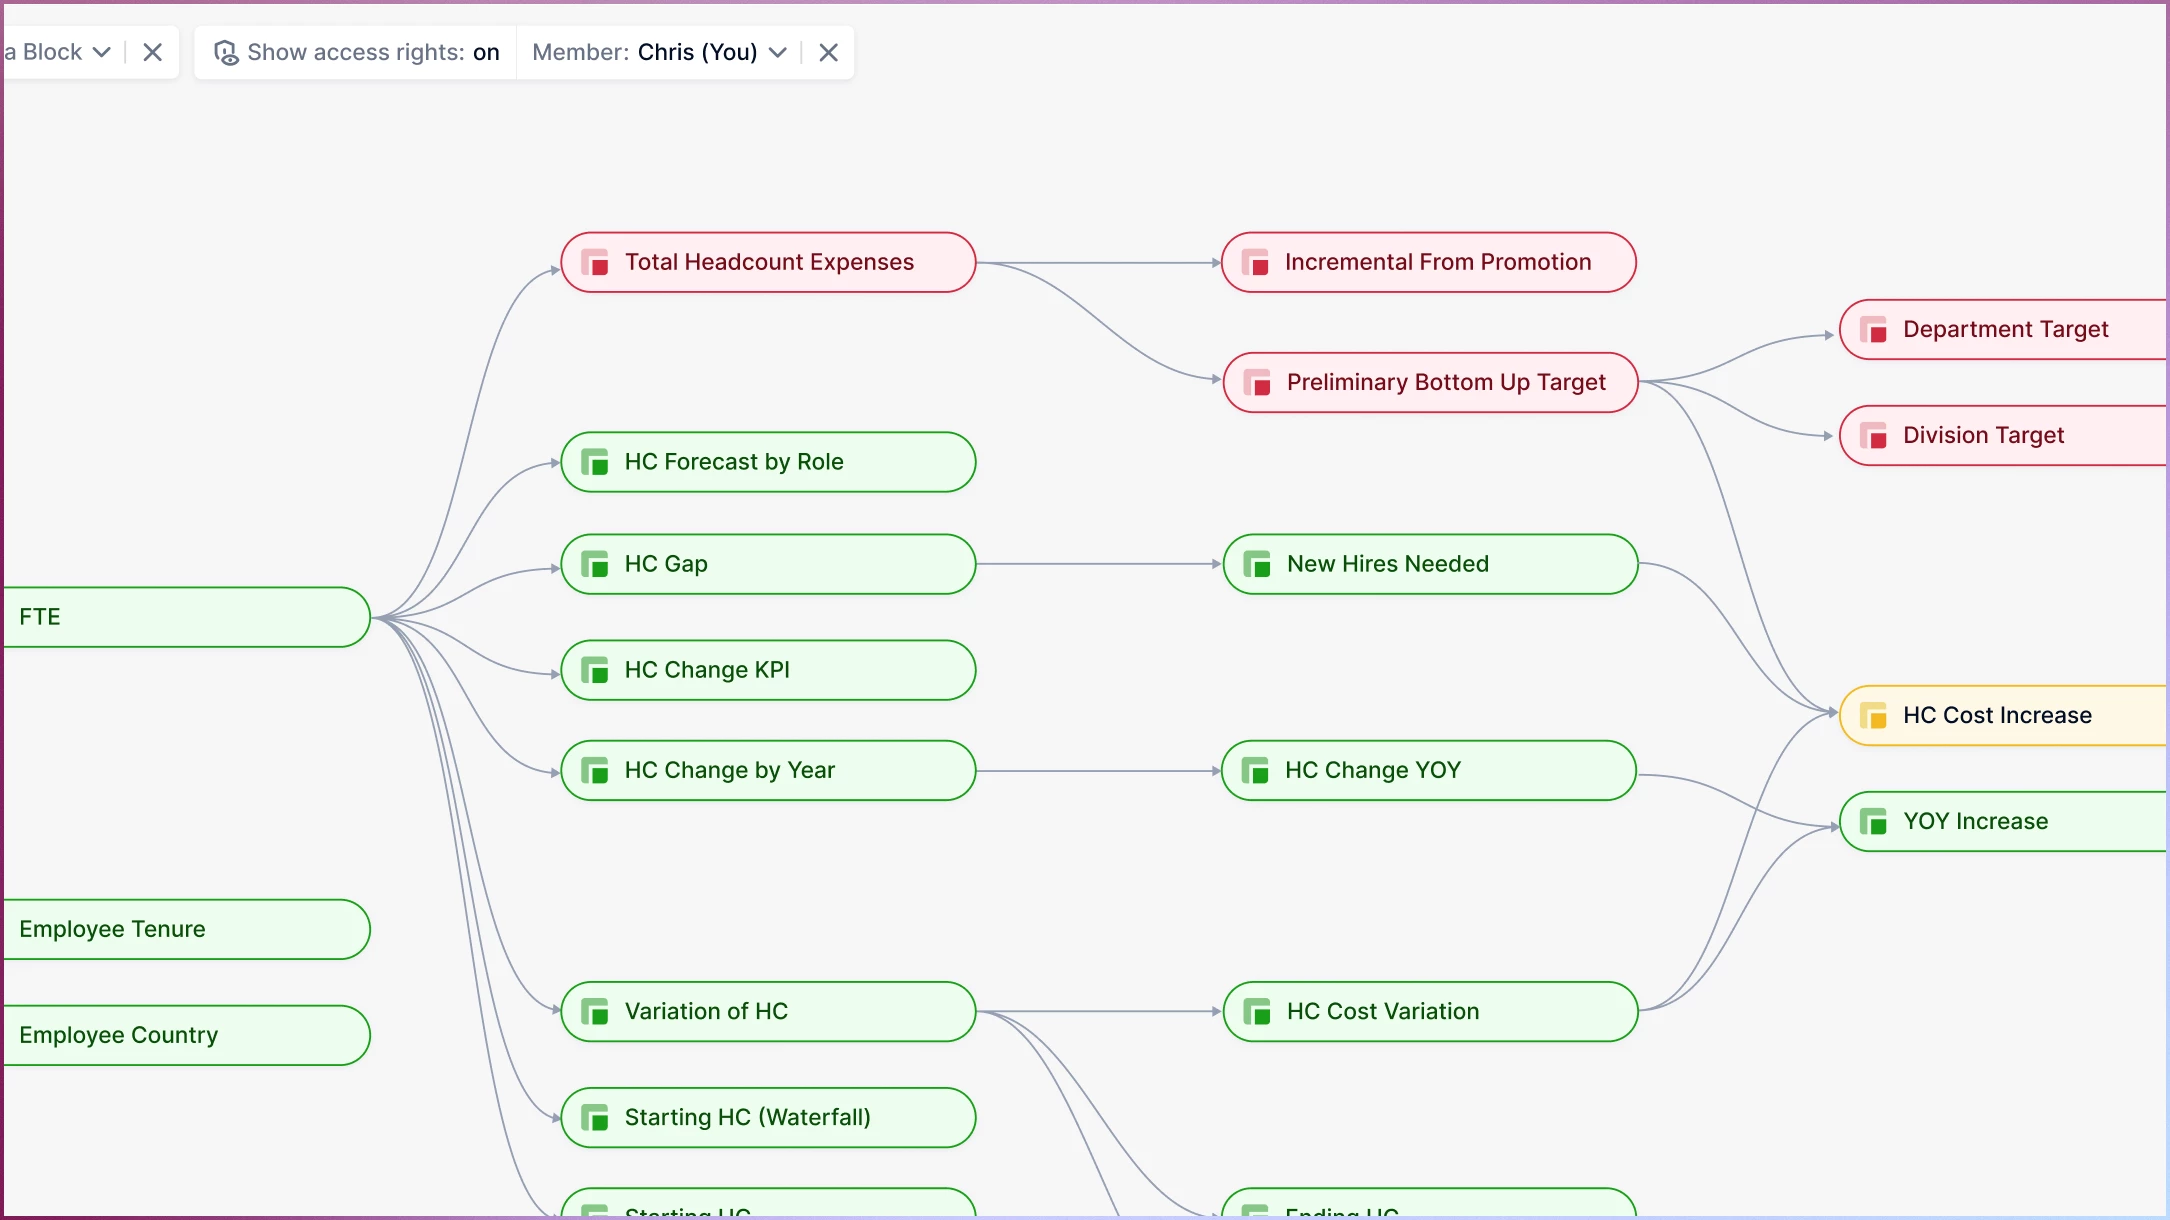
Users with the Define Application security permission can turn on Show access rights. This mode uses colors to mark Metrics and Transaction Lists according to a selected Member’s access rights status:
- Green: Full Access—the selected Member can access all data within the Metric
- Yellow: Partial Access—the selected Member has access to some but not all data within the Metric
- Red: No Access—the selected Member has no access to data in this Metric
After turning on Show access rights, you can select any Member using the Members dropdown.