
During the planning process, you may need to manage multiple plans with different assumptions. This article introduces you to the Version Dimension and describes how you use it to handle planning in your Pigment environment, including in “What-If” analyses.
About the Version Dimension
Version Dimensions are structured as a Dimension list, similar to other business-specific Dimensions, and they typically include items like individual plans and Actuals.
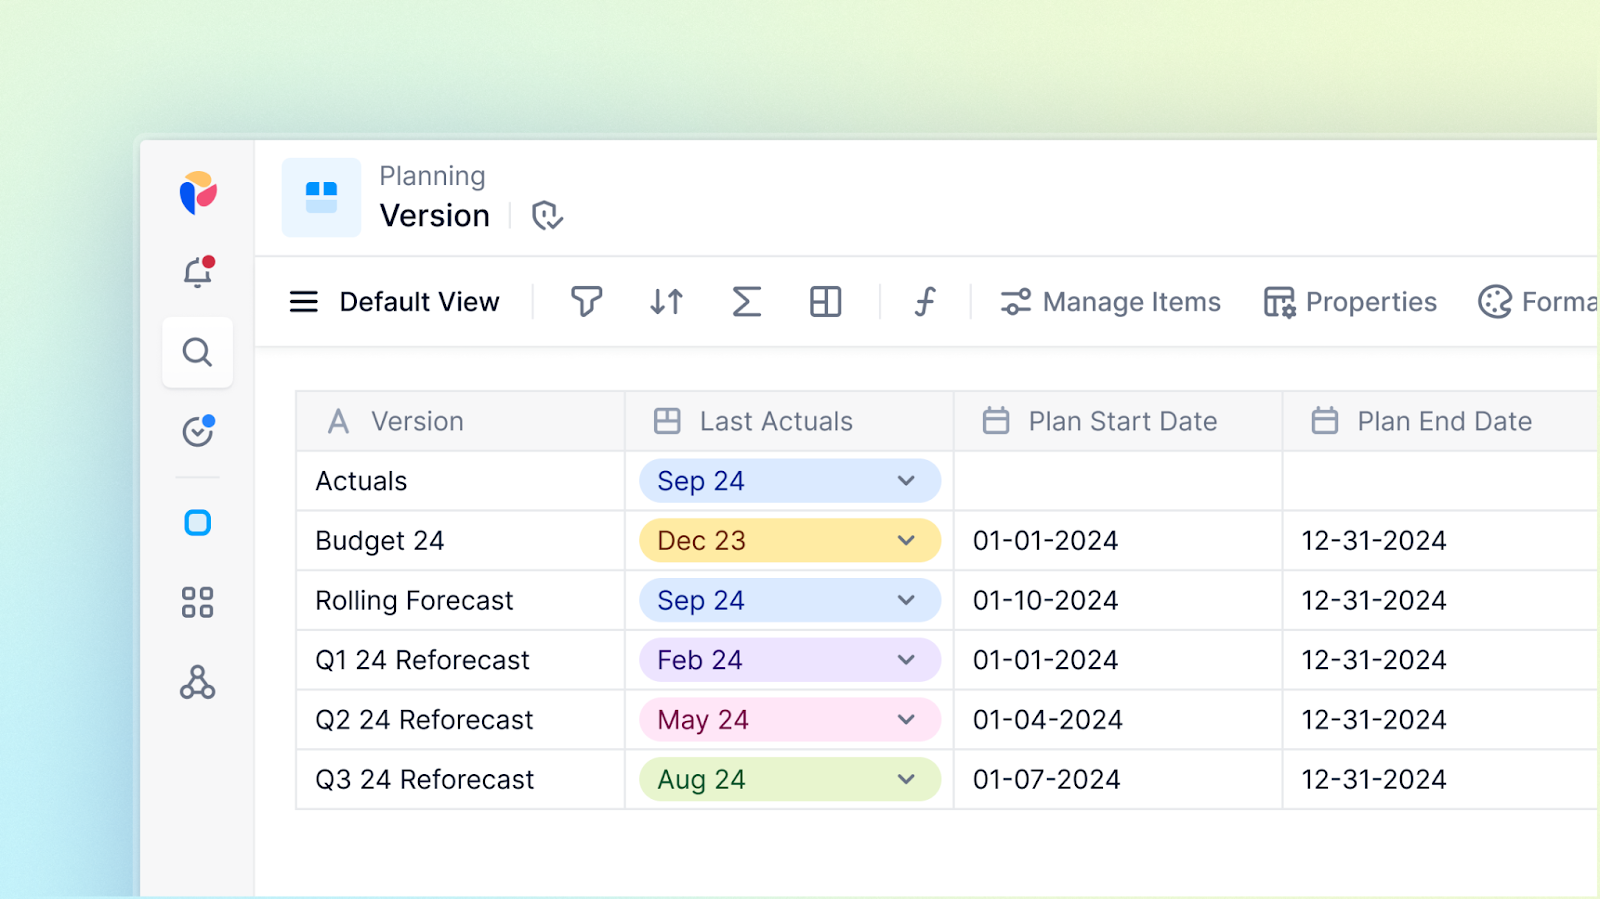
By creating a Version Dimension, you can add individual Items for each plan and structure relevant Metrics with it.
Version Dimensions also allow you to do the following:
- Manage multiple plans and reference them in formulas.
- Manage Member data access.
- Import multiple plans into a Transaction List.
- Use the Clone Data To feature to initialize new plans by copying data from existing plans.
- Adjust data access to specific Members.
Best practices
Ideally, if you want to use the Version Dimension, you should create it at the outset of your financial planning. This allows you to structure relevant Metrics with it as you build, and alleviates the risk of needing to redesign and rebuild later.
We recommend these best practices when you use a Version Dimension:
- Regularly review and clean up your Version Dimension to ensure it reflects current and relevant plans.
- Use descriptive naming for each version to specify clearly what each plan represents.
- Leverage the Clone Data To feature to save time and ensure consistency when creating new plans.
Set up a Version Dimension for planning
To set up a Version Dimension in Pigment, do the following:
- Open the Application where you want to set up a Version Dimension.
As a best practice, this should be in a centralized location, such as your Hub Application. - Create a new Dimension called Version.
- Create Items in the Dimension for the required individual plans and Actuals.
For example:- Actuals
- Budget 2024
- Rolling Forecast Q1 2024
- Create the Blocks in the Application that need to be versioned:
- Include data from multiple plans, such as budgets, forecasts, and actuals.
- Structure these Blocks using the new Version Dimension.
This organizes and structures your data by each version.
Manage plans in the Version Dimension
- To add a new plan:
-
Create a new Item in the Version Dimension List, for example: Reforecast Q2 2024.
-
- To base a new plan on an existing plan:
a. Use the Clone Data To feature in Pigment.
b. Structure these Blocks using the new Version Dimension.
For example:
- Source version: Budget 2024
- Target version: Rolling Forecast Q2 2024
c. Adjust the cloned data as needed for the new version.
Plan with "What-If" Analyses
Creating "What-If" analyses in Pigment allows you to explore alternative outcomes for your plans, such as best-case, worst-case, or expected results. Depending on your Application's current set-up, you can use Scenarios for quick and flexible adjustments or the Version Dimension for structured, detailed comparisons. By leveraging either of these, you can evaluate potential impacts, refine forecasts, and make better informed decisions.
Implement a “What-If” Analysis
How you approach implementing a “What-If” analysis depends on whether your Pigment Application currently uses Scenarios or the Version Dimension:
- Scenarios: Continue using Scenarios.
- Version Dimension: Choose one of the following:
- Add additional Items to the Version Dimension.
- Combine Scenarios with the Version Dimension.
Examples of "What-If" Analyses
Here are examples of when to use a Scenario, Version Dimension, or to combine both in a “What-If” analysis:
- Scenarios. You want to evaluate potential financial outcomes for the next four quarters. Here you would create multiple Scenarios that assess the range of potential outcomes for each quarter.
- Version Dimension. You want to analyze all possible combinations of plans and outcomes for the financial year to assess their impact on your strategy.
These are example combinations you may itemize in your Version Dimension List:- Actual
- Budget 2025 - Expected
- Budget 2025 - Pessimistic
- Budget 2025 - Optimistic
- Q2 Reforecast 2025 - Expected
- Q2 Reforecast 2025 - Pessimistic
- Q2 Reforecast 2025 - Optimistic
- Q3 Reforecast 2025 - Expected
- Q3 Reforecast 2025 - Pessimistic
- Q3 Reforecast 2025 - Optimistic
Create a Version Dimension, listing each of these as a List Item. You can then use this Dimension to structure all relevant Blocks in your planning—if you haven't already done so.
Restructuring input Metrics can lead to significant data loss. To prevent this, consider duplicating the affected Metrics and their inputs before making any changes.
- Combined Approach. You want to visualize reporting assumptions side-by-side, but you also want to structure your model’s Metrics on specific, potential financial outcomes.
For example, you could create individual Scenarios for Expected, Pessimistic and Optimistic outcomes, without needing to specify each of these as an Item in the Version Dimension:- Actual
- Budget
- Q2 Reforecast 2025
- Q3 Reforecast 2025
We recommend that you use the combined approach only if you need to create Scenarios dynamically alongside Versions. Doing this allows you to test different assumptions across all Metrics and Versions in the Application. However, if you need full flexibility to compare different combinations in your reports, we recommend that you use the Version Dimension.