
You’re probably reading this because a Pigment error relating to circular references has brought you here. Circular references mostly appear when you’re trying to calculate an amount on which you apply increases / decreases.
Planning formulas in Pigment involves letting Pigment know what to calculate first to optimize the speed and efficiency of your model.
Contents
Why does block order matter in formulas?
Formulas in Pigment work well when Pigment knows what to calculate first. Pigment calculates metrics in a certain order. To make for an efficient and fast model, blocks are calculated separately and sequentially.
How do I know the order in which Pigment calculates blocks?
If you open a dependency diagram on a metric, you’ll see the order in which Pigment calculates blocks: all dependencies, the sources on the left and the metrics using your block on the right.

You can’t have an arrow going backwards - if that were the case, how could Pigment know which metric to calculate first?
It may not be the case in your current tool - a spreadsheet, target architecture / draft or existing EPM, but even though you feel like the different calculations are interdependent, most of the time you can get away with ordering your metrics in a neat sequence.
Guidelines for eliminating circular references in your model
-
Plan ahead: identify the metrics for your model beforehand to make sure you have accounted for all your inputs, outputs and calculations
-
Separate your inputs and outputs
-
Use the dependency diagram to ensure that you are referencing metrics to the left in your formulas (such as previous month / year)
-
Reorder your metrics in your output table so that it makes the most sense for your users.
-
Calculate some indicators twice
An example: calculating the Annual Recurring Revenue (ARR)
Let’s take the example of a business that sells recurring services to customers paying a monthly fee. You want to model the ARR (Annual Recurring Revenue), which can be affected by new business (new ARR), churn (lost ARR, clients leaving the service), upsell (selling more services to existing clients) or with downsell (selling less services to existing clients).
Building a purely recursive model, here’s how it would look:
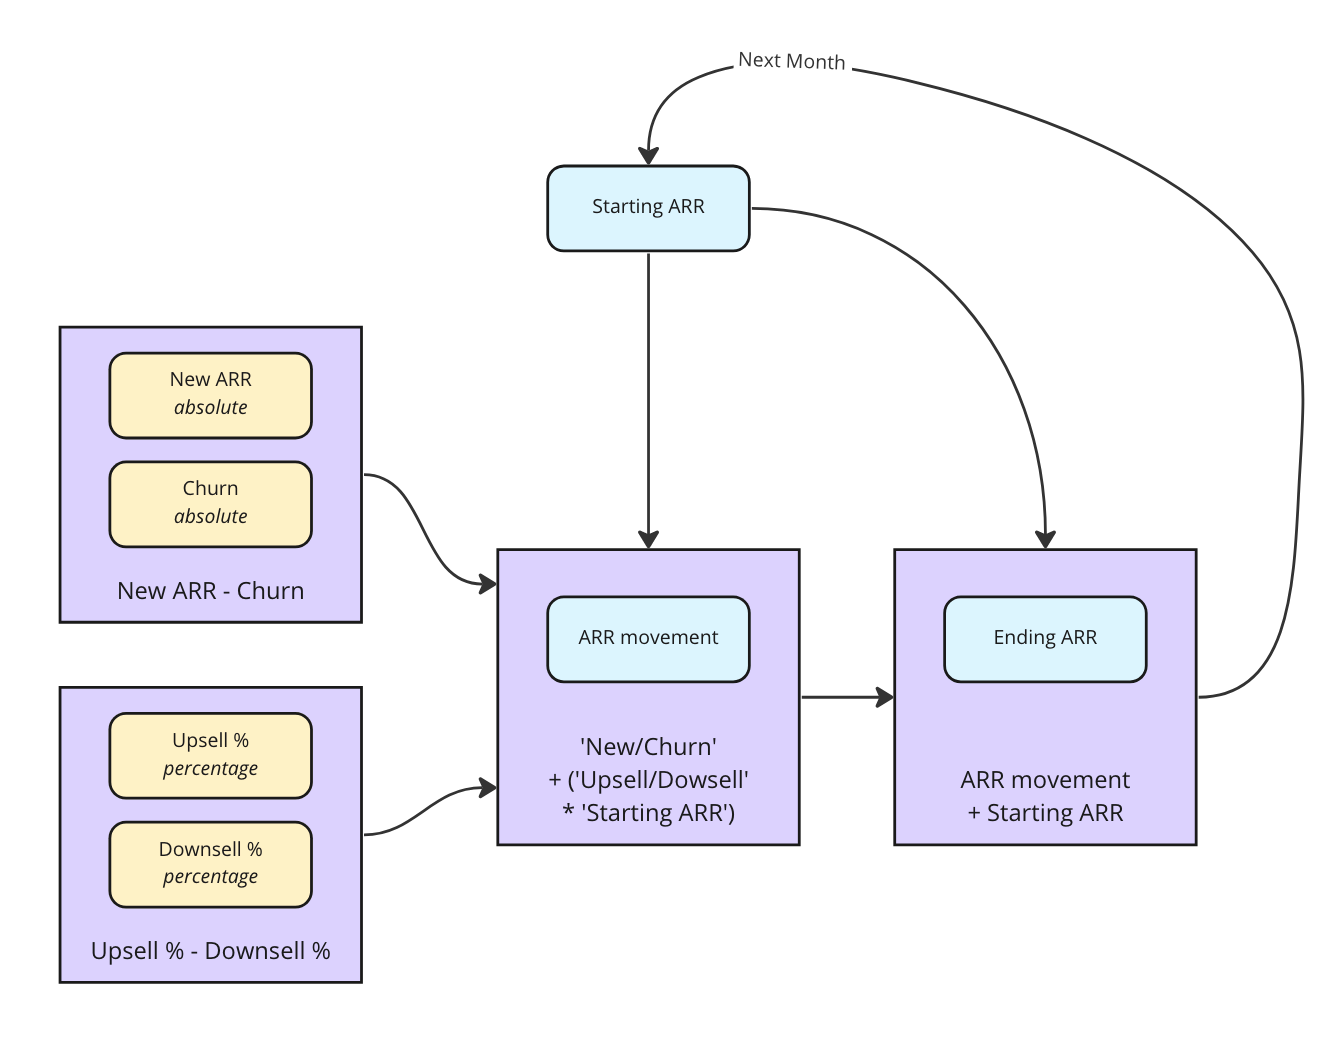
With your assumptions for each month in yellow, you first calculate ARR movement based on the Starting ARR, and add this to the Ending ARR.
This will get shifted the next month to restart the calculation.
Unfortunately, this is incompatible with Pigment’s way of organizing the calculations. As you can see, there’s an arrow going backwards from Ending ARR to Starting ARR. This is difficult for Pigment because it waits for the calculation of a whole block before working on the next one.
Identify the order of your inputs and outputs
The best way to avoid a circular reference is to first list what goes in your calculation and what you want to get out of it. Your inputs may come from different sources:
-
Actuals data from an accounting software
-
Forecast based on assumptions you’ve built somewhere else in Pigment (e.g. another application)
-
Just an input in a metric
Let’s focus on what kind of assumptions we have, regardless of their sources.
In our case, here are the inputs:
-
New ARR / Churn ARR are absolute numbers. This means they contain amounts in currency
-
% of Upsell / Downsell. This is an assumption based on the Starting ARR - a 1% upsell on a typical month would mean if you’re starting with $100k your upsell will be $1k
Here are the expected outputs
-
For all months
-
Total ARR
-
Detailed absolute ARR movements (incl. Upsell / Downsell)
-
Detailed relative ARR movements (incl. New / Churn %)
-
Make the arrows go right only
To make sure Pigment calculates your blocks, they have to go from left to right, and make no backwards arrow.
To do that, we’ll have to duplicate some of the calculations: instead of calculating the ARR movements, and then applying them to the Ending ARR, we’ll actually calculate them twice: within the Ending ARR and as a standalone reporting metric. Same thing happens with the Starting ARR, which is also calculated afterwards, as a standalone reporting metric.
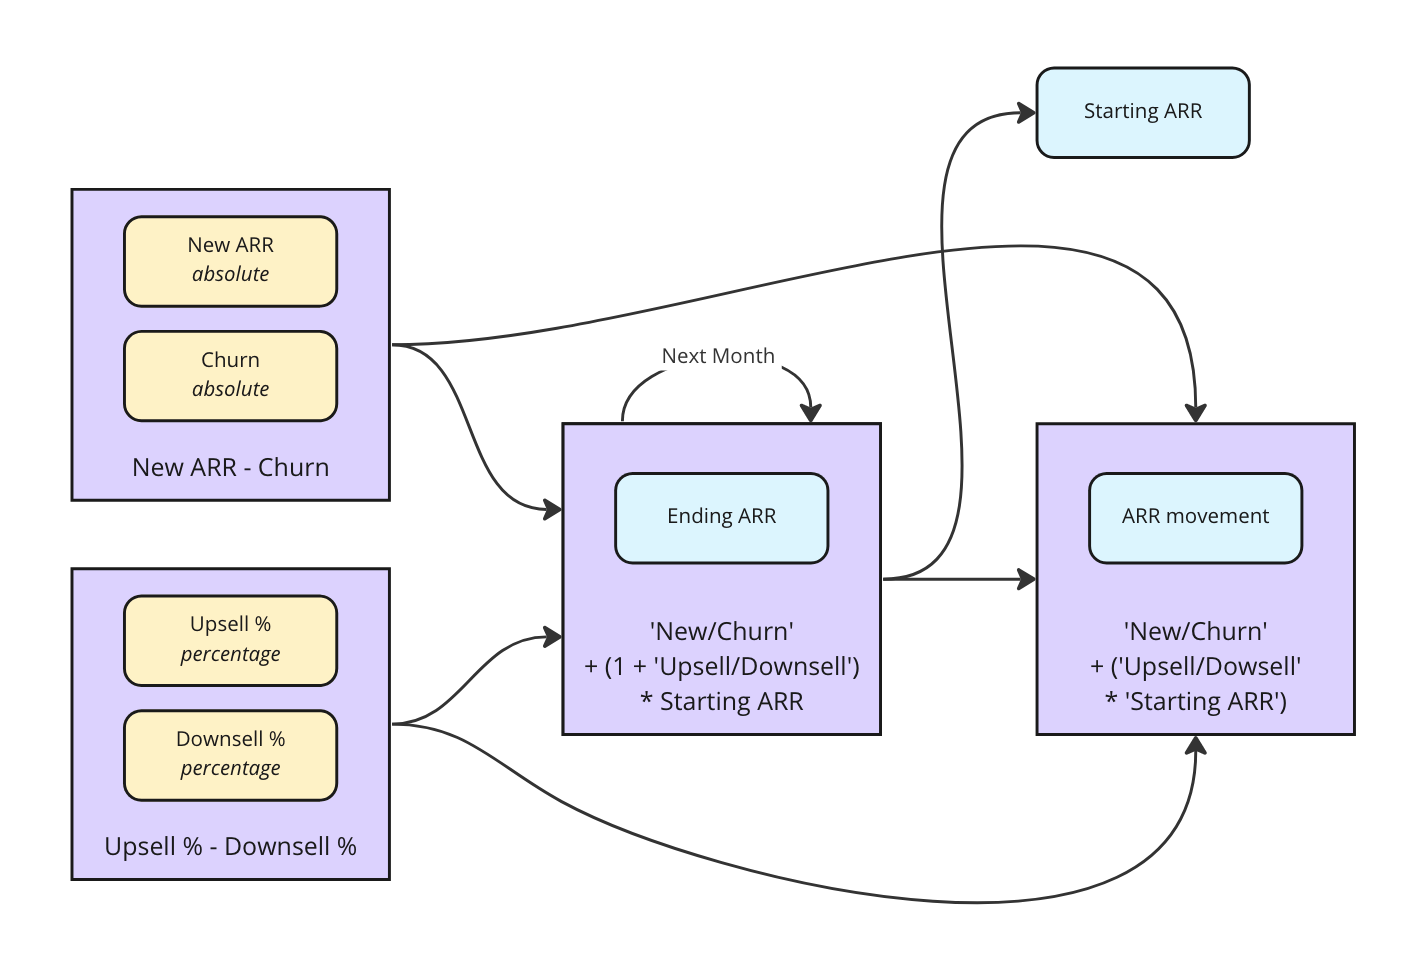
With this approach, you no longer have backwards arrows.
In order to do this, we need to make a recursive calculation in the Ending ARR metric: the calculation has to reference its previous months’ value. To use this, we can use the PREVIOUS on the Month dimension, so that each Month gets individually calculated, one after the other.
If there’s one thing you should remember from this article: recursive calculations can only happen within one metric. You should pack all your recursive logic in one formula (here, Ending ARR) and re-calculate all indicators afterwards.
Creating your blocks in Pigment
I won’t describe the formulas for the inputs in the model, as they may either come from another block (a formula specific to your model) or be a simple input (no formula.
However, we’ll have to calculate the Ending ARR, and display both detailed ARR movements and the Starting ARR.
Ending ARR
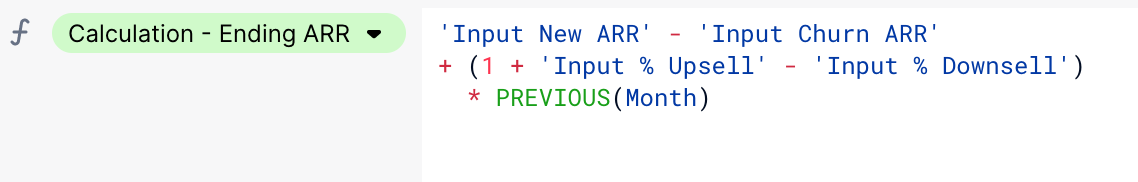
For the Ending ARR, I’m doing this in two steps:
-
Adding the New ARR and Churn ARR
-
Multiplying the previous month’s value (PREVIOUS(Month)) to a growth based on Upsell / Downsell %.
This can already be shown in a table
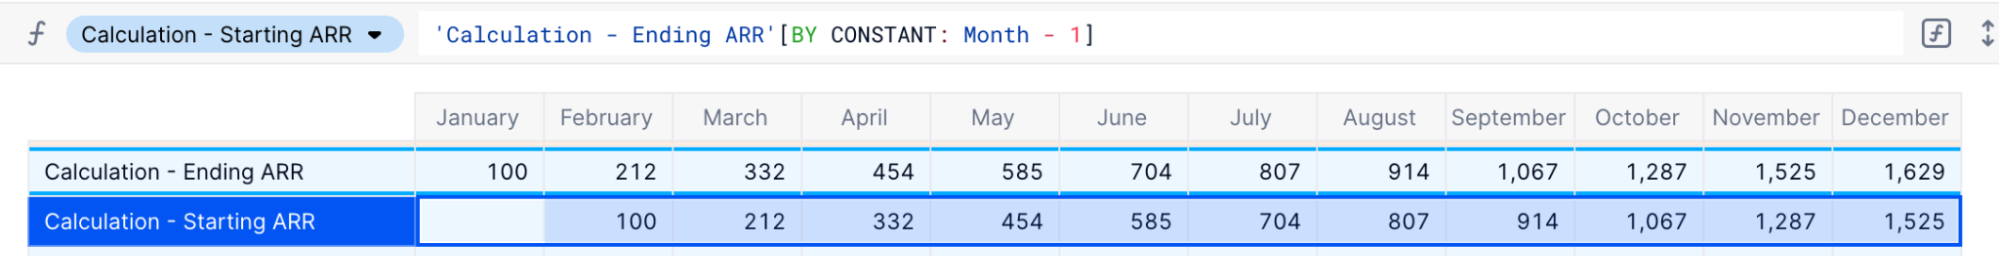
Starting ARR
While for sole reporting needs, we’d only need to display the Starting ARR using the Show Value As feature, we’ll need the values for the ARR movements calculations / display. You can simply duplicate the Ending ARR metric and use the formula 'Ending ARR' to shift values one month in the past.
ARR movements
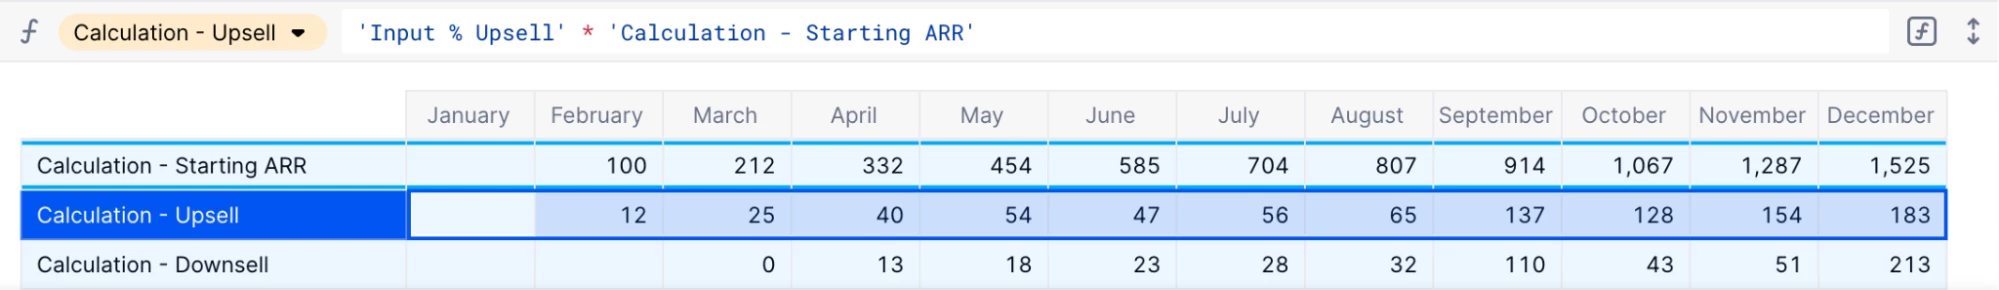
While we can use the Show Value As feature to display relative values, we’ll have to create new metrics for the absolute values of our Upsell and Downsell.
As we want to multiply the Input % by the starting ARR, we can use the above calculation and use the following formula 'Input % Upsell' * 'Starting ARR' and the corresponding one for the downsell.
For the relative % movements, we can simply use the Show Value as feature by right-clicking on the Input New ARR metric > % Show Value as… > % of… > Metric and then choose the Starting ARR metric.
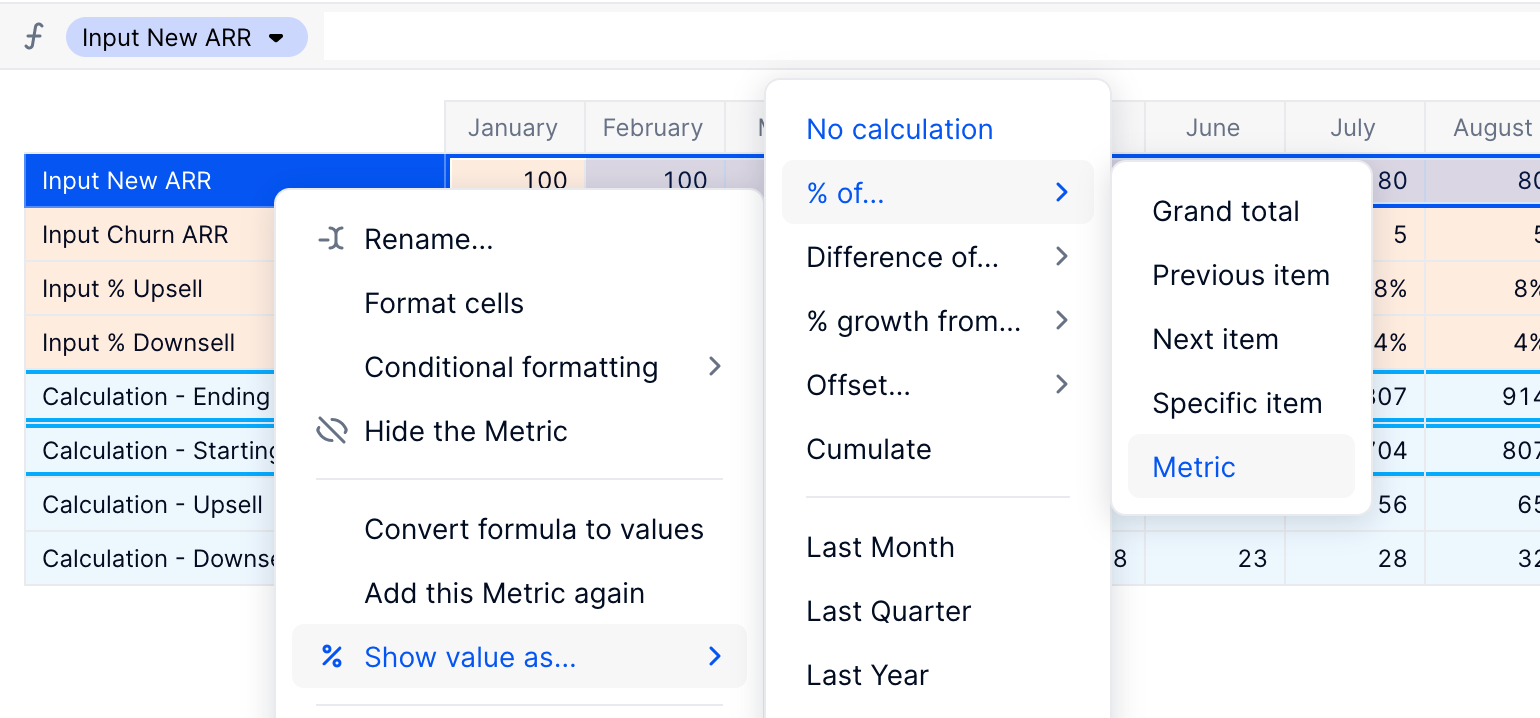
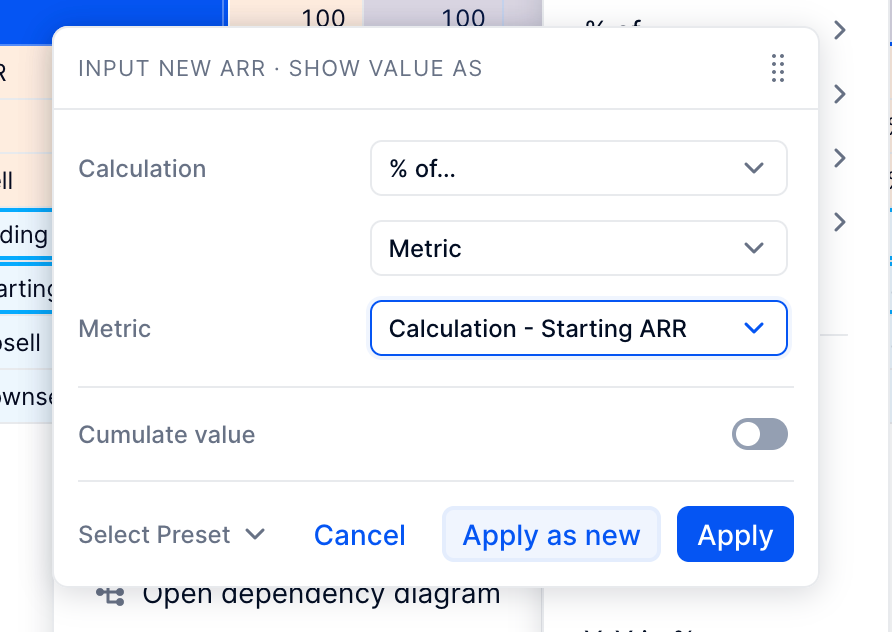
You can name it as New ARR % in your table, and repeat the operation with the Churn ARR %.
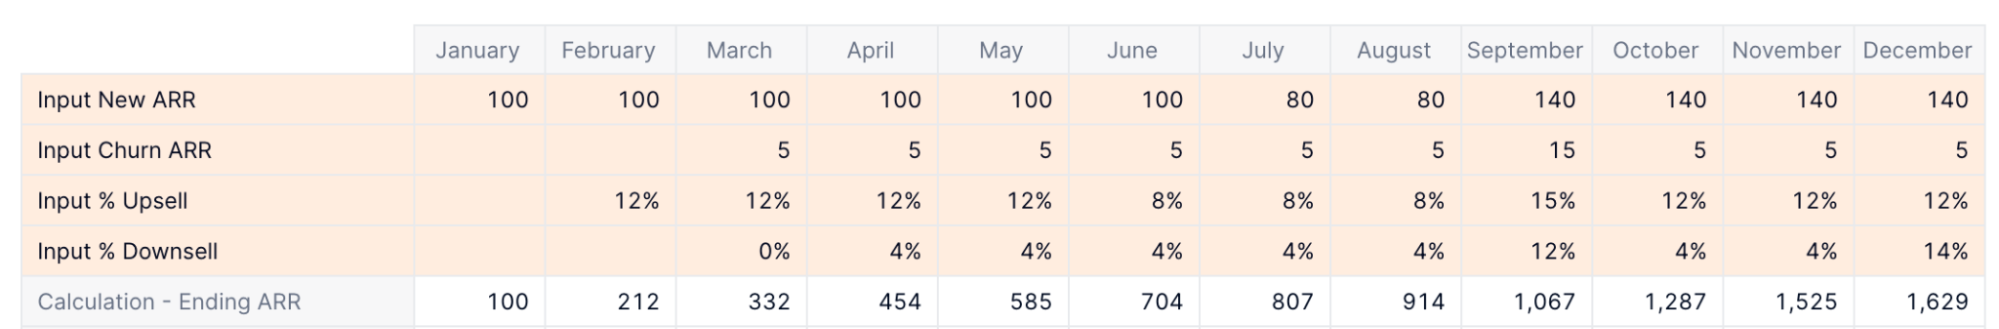
Final table
After reordering the metrics in a more readable fashion, here’s what I come up with:
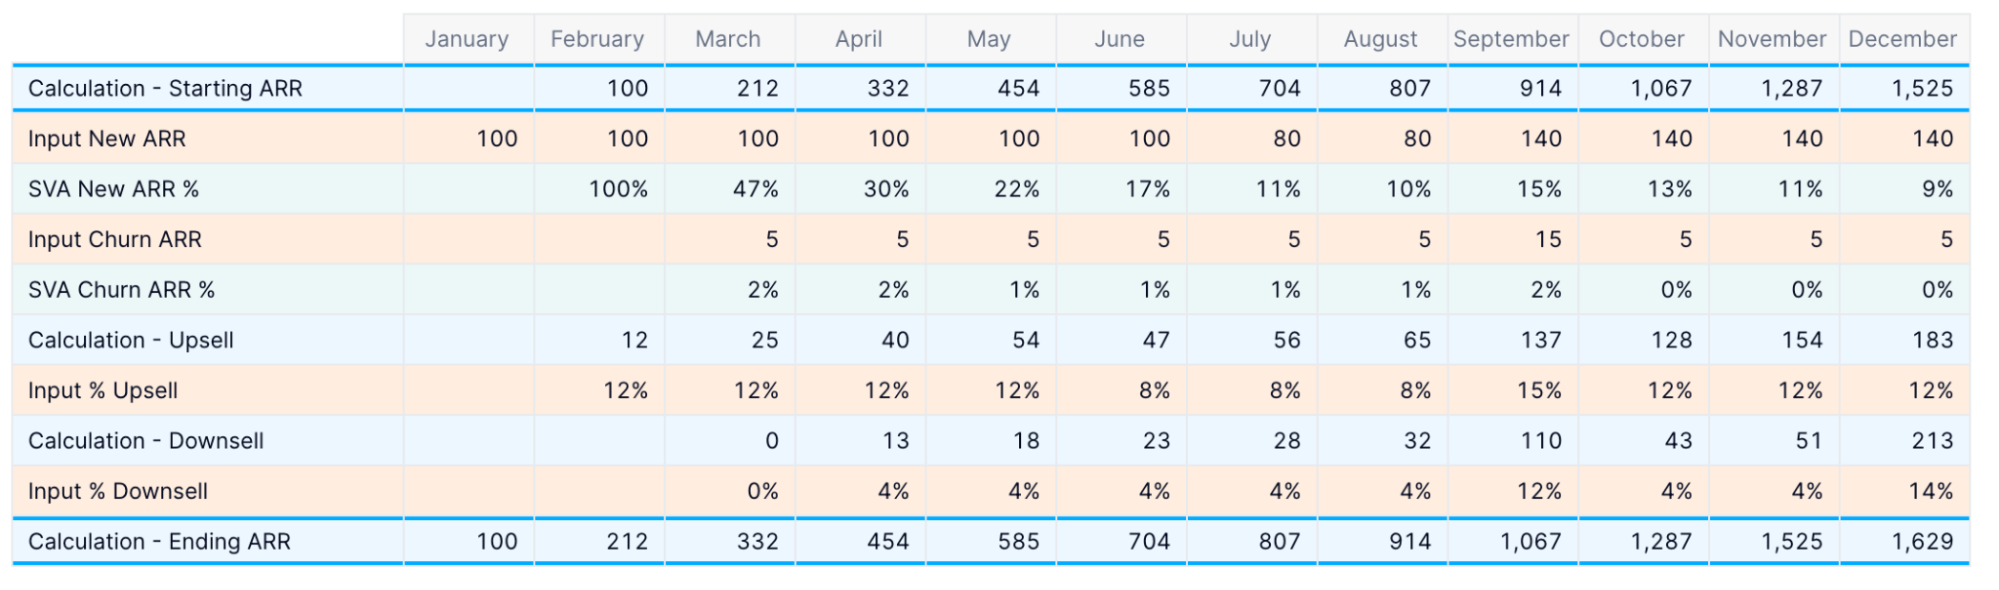
In orange are the starting / input metrics, in blue the calculation metrics and in green are the SVA, e.g. just duplication of existing metrics displayed as a ratio.
Here’s the corresponding dependency diagram:
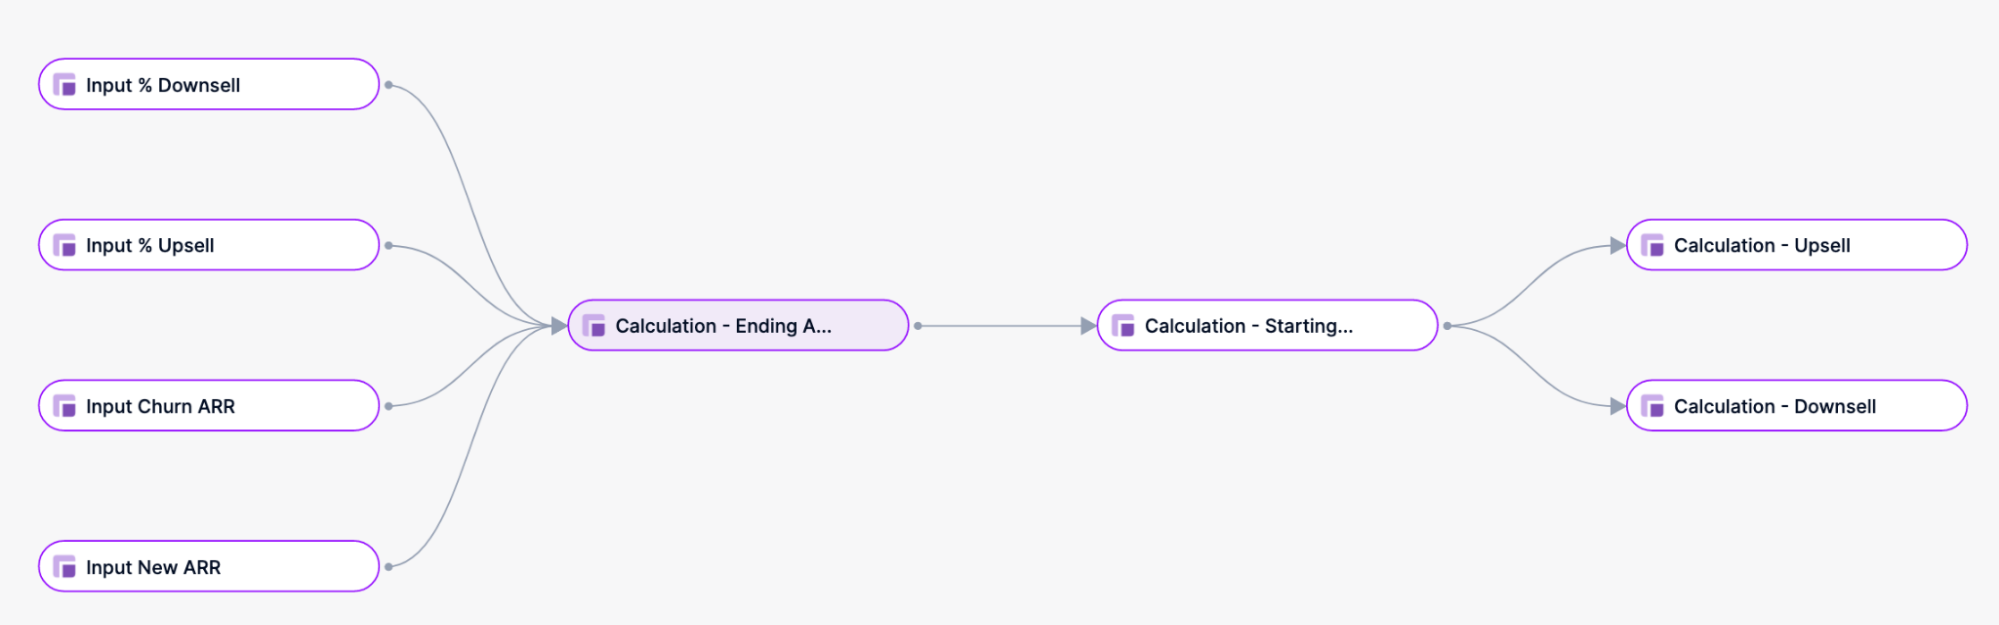
This follows the architecture diagram from above. You can’t see New ARR % and Churn ARR % because they’re only calculated on the table using the Show Value As feature.
Multidimensional ARR
While this example is fairly simple, it’s good groundwork to build much, much more complex models on Pigment. Although this example is simply mono-dimensional (ARR per month), the exact rules still apply with a lot more dimensions. Just edit your metrics structures with the relevant dimensions (e.g. Country, Product, Customer type or even Cohort), fill in the proper assumptions and the table will work exactly the same way.
Having used the Show Value As feature ensures that ratios are always correct at the aggregated level. If you also want to display the input ratios at an aggregated level, you might want to re-calculate the absolute first and only display the SVA though.
Input format depending on the period type
If your assumptions depend on whether you’re looking at the Actuals or the Forecast / Budget Period, you can tweak your formula to accommodate this particularity. In that case, simply provide different calculation methods based on a Month filter.
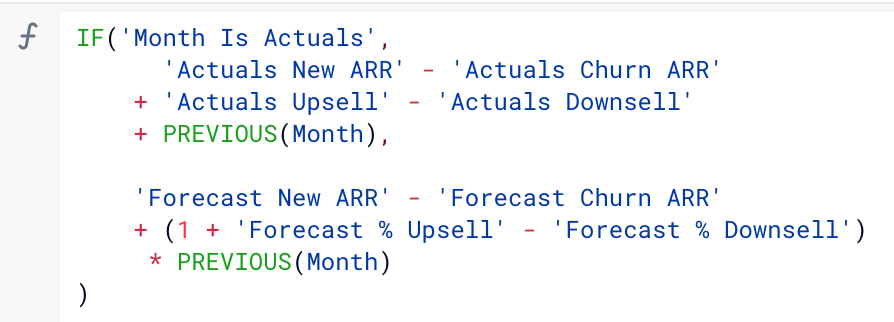
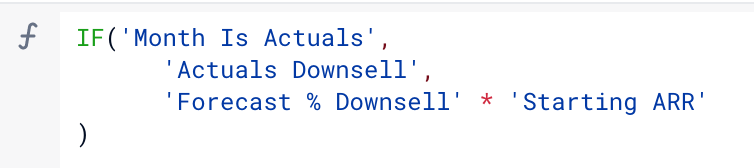
Depending on your existing architecture, here’s what the formula for your Ending ARR formula could look like
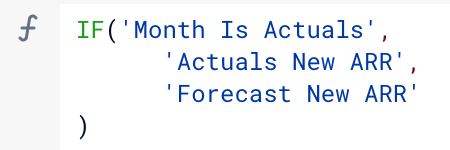
In that case it would be better to replace all lines displayed in your table with calculated ARR Movements, with formulas like this in the example of New ARR and Downsell respectively:
The ratios would then be displayed as SVAs of the Starting ARR.
Did this article help you? Do you have a case you can’t crack? Feel free to open a new topic and explain your architecture with a schema or with a detailed spreadsheet. I’d love to complement this guide with common issues that you may encounter.