


This article will present an example of an FX Rate management set up built in Pigment in a matter of minutes by leveraging the Google Sheet Connector and Pigment’s import capabilities.
Before diving into the explanation, what does FX Rate management set up refers to?
It’s used here to describe the collection of the historical exchange rates of multiple currencies used during your planning process to be able to convert amounts to your unique reporting currency. For example, your Budget Owners are planning their employees salaries in their local currency. In order to see a consolidated amount you need to convert all the salaries to your official reporting currency. Before choosing to use the method described below, you should validate the process internally!
Step 1: Create a Google Sheet that will contain Daily FX Rate
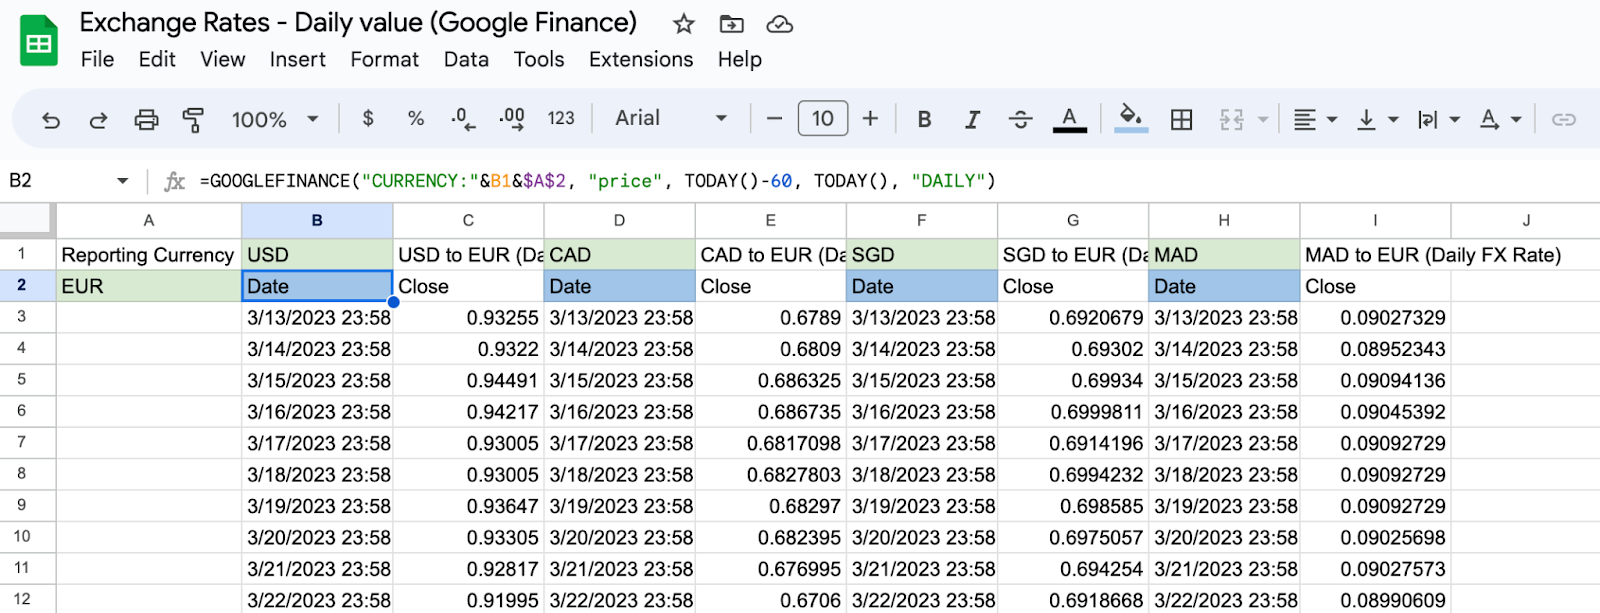
In the Google Sheet you created you can define your reporting currency, meaning the currency you will want to convert to in your Pigment applications. In this example I used the “EUR” currency code (see the ISO 4217 code list).
The function used is GOOGLEFINANCE() with the reporting currency as parameter and any other currency I want to add to my FX Rate logic (here: USD, CAD, SGD and MAD). The goal is to retrieve the daily rate for the last 60 days. To load the historical FX Rate, we will change this parameter to 2 years or more depending on the need and then switch it back to 60 days.
Each time I will open this Google Sheet, the values will be updated to display the last 60 days daily FX Rate. We chose to retrieve the Daily FX Rate instead of the Weekly because we can easily link a day to a particular Month in Pigment to calculate an average FX Rate per Month, which isn’t the case with Weeks.
This is how your Google Sheet should look like:
Step 2: Connect the Google Sheet to Pigment using the native Connector
Once the Google Sheet is ready, we can connect it to Pigment through the native Connector. If you haven’t already installed the connector, you can find detailed instructions on how to set it up here.
We will use the “Push data from Google Sheets Into Pigment” button. If it’s your first time pushing data from Google Sheet to Pigment, you will find detailed instructions here.
Step 3: Generate the import ID
Follow the instructions in the article above to fill the Pigment tab automatically created. The only missing information will be the “Import ID”. To find this information, you will need to first run the import manually with a CSV file.
This article also explains how to generate the import ID.
Start by filling all the fields except the import ID like indicated below:

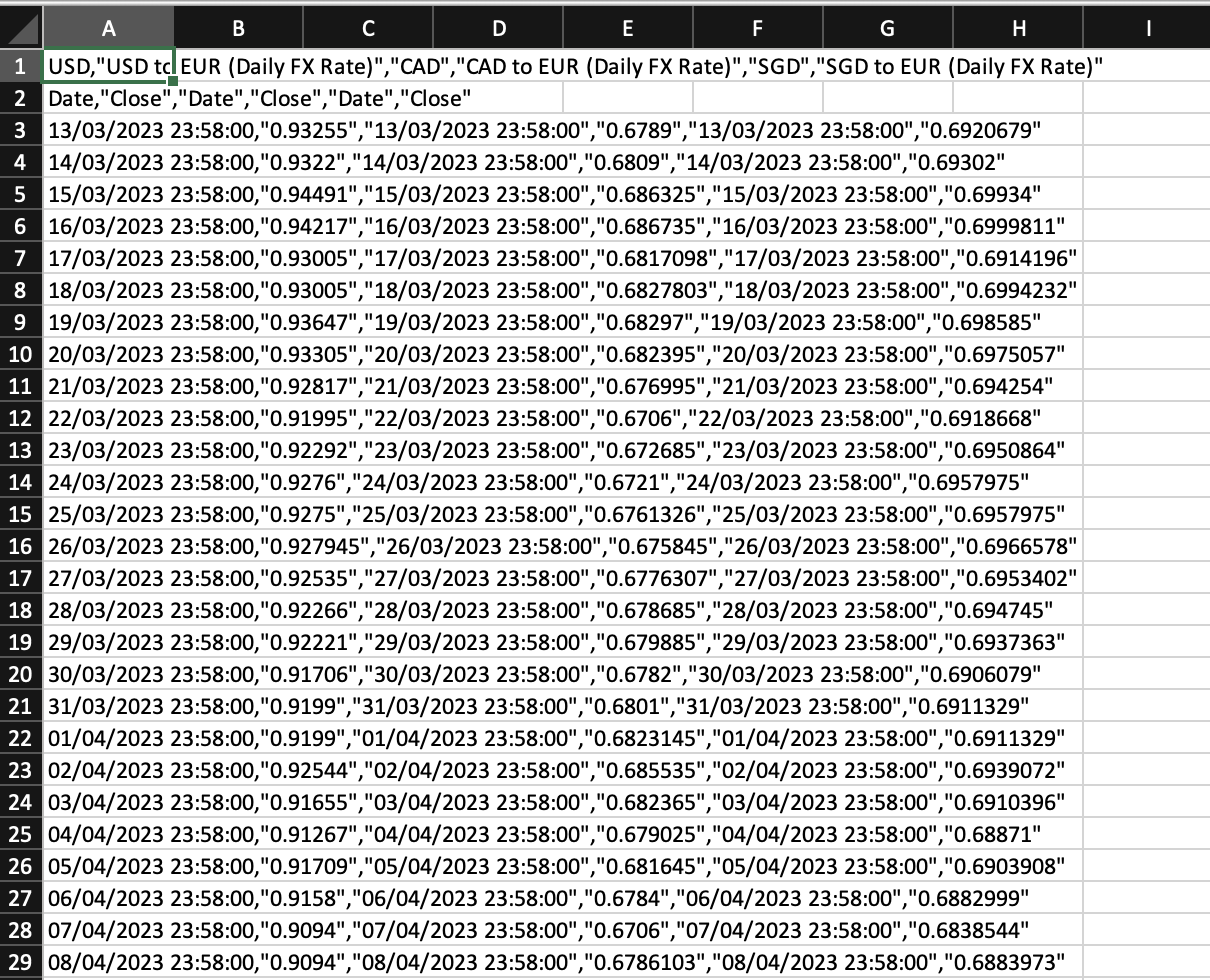
You can now use the “Download export data as CSV” button on the side bar to generate a CSV file that you will import manually in Pigment to generate the import ID needed to automate the setup.

Your CSV file should look like this:
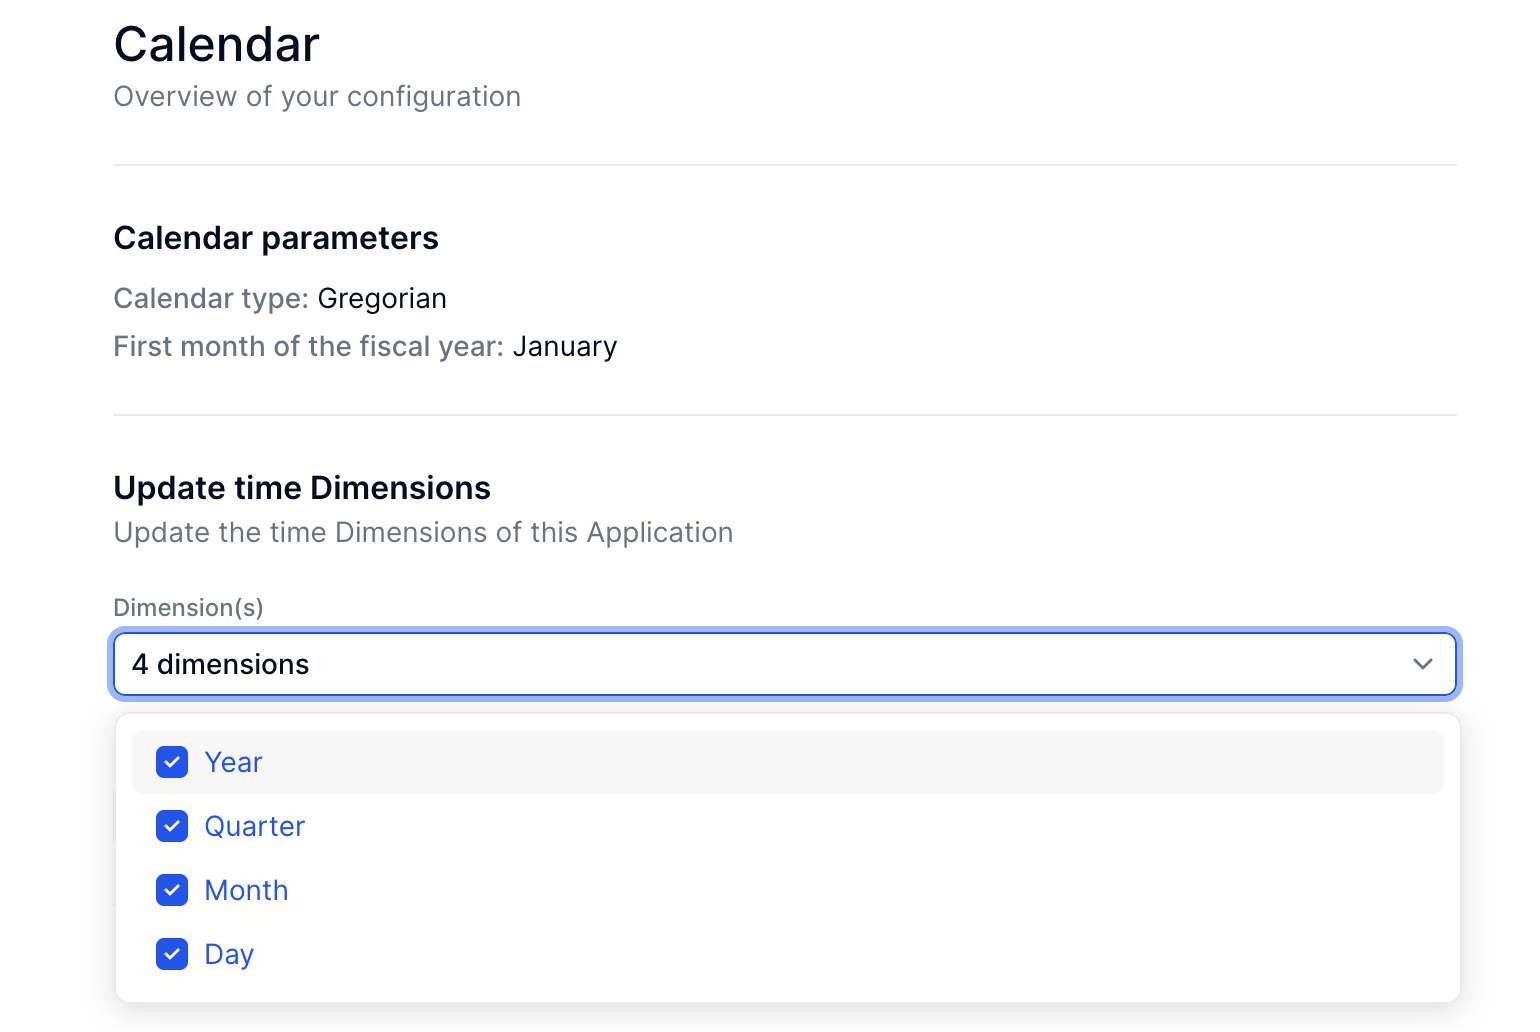
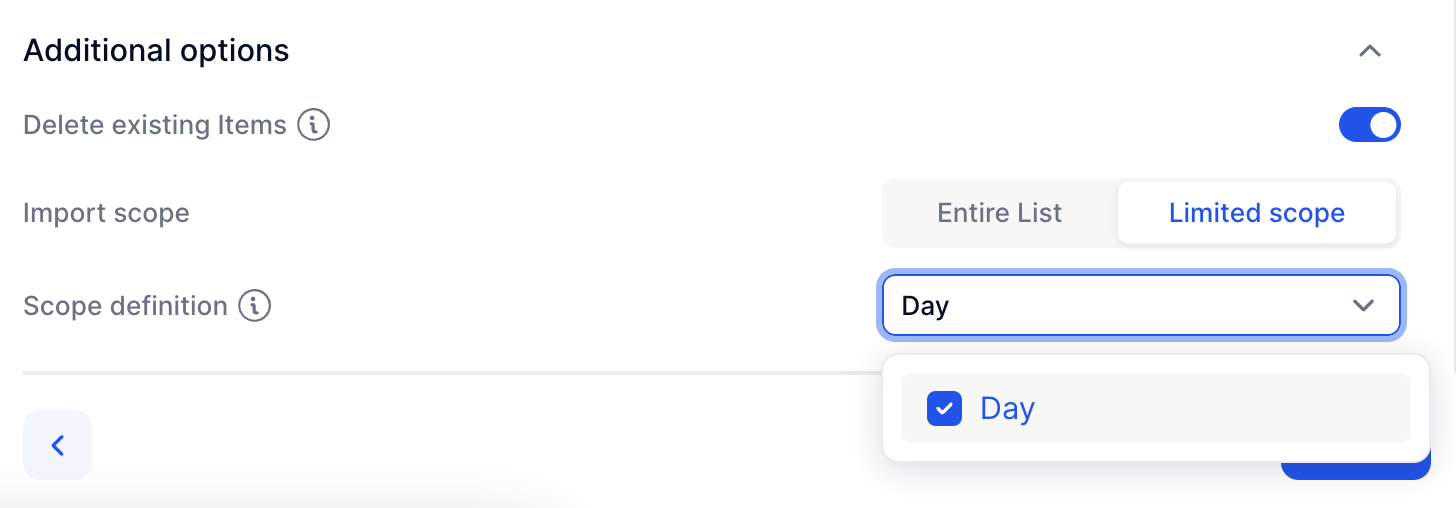
Important note: You need to have a calendar with the “Day” dimension as the data generated on the Google Sheet is by day. We will use the “Day” as our scoping parameter to reload the data and keep all historical exchange rate while adding new data. See in this article how to add the dimension Day in your calendar
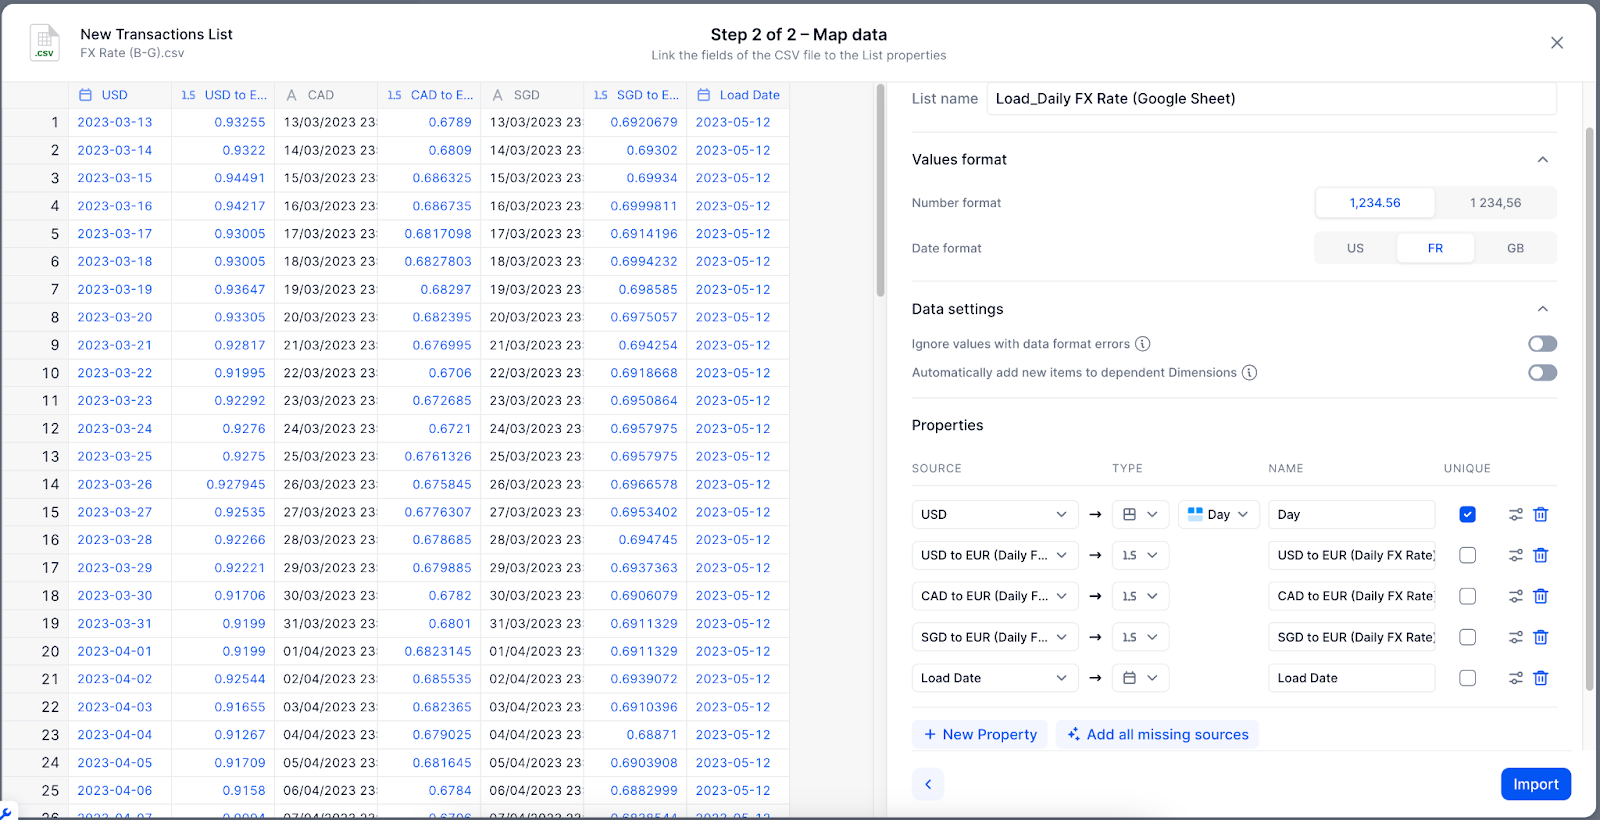
Import the CSV file that has been previously generated by using the “Start from an import” option in Pigment in a new Transaction List.

Here is how your import configuration should look like:

We will only keep the first column with the “Day” information and the ones containing the FX Rate for each currency. The “Day” will be our unique property and also the dimension we will use to scope the import. That way we will keep the historical data and update the transaction list with the new FX rate.
Don’t forget to save the import configuration once the import has been completed; we need this to be able to use the import ID that will be generated when saving.

When the manual import has been completed successfully, you should have a transaction list like shown below.

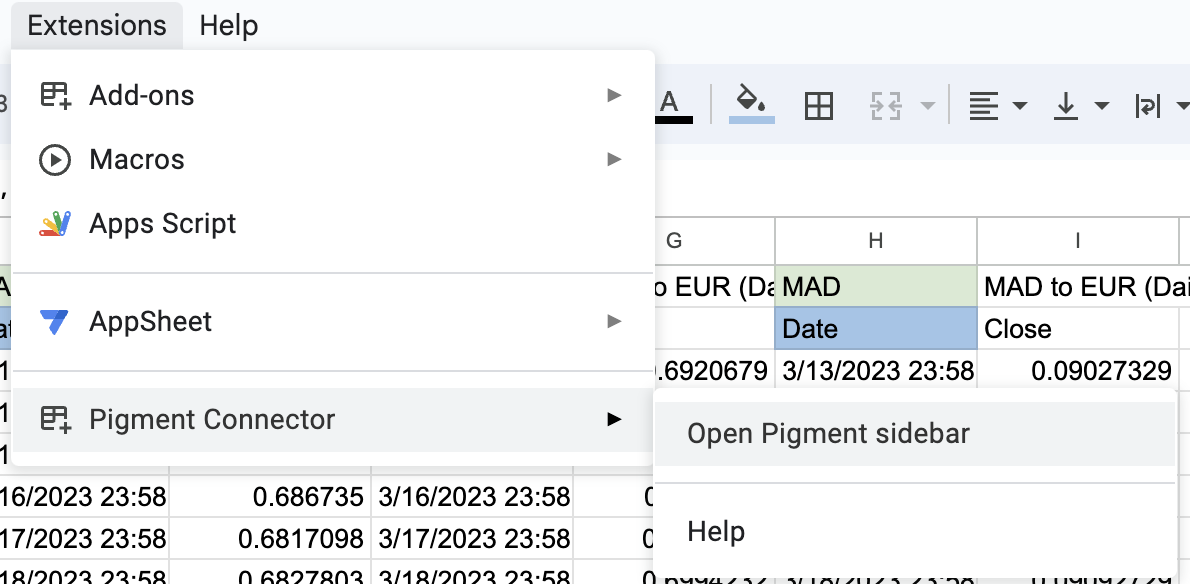
You can now copy the import ID from the settings of the Transaction List that was just created and paste it into the “Pigment” tab of the Google Sheet. To run a test, you can delete the entire transaction list you just manually loaded in Pigment and reload it directly from Google Sheet by hitting “Export data to Pigment” on the Pigment sidebar.
If all goes well and you carefully followed the previous steps, you should see a popup indicating the success of the import in your Google Sheet:

The transaction list in Pigment has been updated with the values from the Google Sheet. To update your Transaction List and send the most up to date FX Rate to Pigment, you will need to open your Google Sheet, open the Pigment Connector panel and use the “Export data to Pigment” button and that’s it!
Step 4: Create the FX Rate Metric
Now the fun part, to be able to use the data from the Transaction List we just created, we will need to create a Metric that will be aggregating this data. Use the formula Wizard from the Playground to build the formula or build it from scratch.
We will use the different properties of the transaction list to create this FX Metric. If applicable, add the Version dimension to the structure of the Metric to be able to have a different FX Rate depending on the Version.

If you would like to use the last known FX Rate to forecast the future Month, you can use the previous() function:

Once your Metric is created, don’t forget to share it in the library with other applications from the settings of the Metric.
You can now use the FX Rate Metric to convert any amount to EUR in any application with the library activated.
Note: this formula is performing an average value of all the FX rates of the Month. You can replace the aggregation parameter with “LASTNONBLANK” to use the last value of the Month if it’s the preferred method.
Step 5: Build a nice Board in Pigment with instructions to update the FX Rate
To finish the job, the last step will be to build a nice board with a button that you can link to the Google Sheet for a quick update. You can also display the last load date for reference and give the possibility for an admin to override the FX Rate on a particular Version (like the FX rate used for the Budget for example).
Here is an example of a Board for FX rate Management:

If you want to add new currencies in you setup, you will need to follow the steps below:
- Change the Google Sheet by adding new FX Rates as columns
- After changing the end Range on the Pigment tab, generate a new CSV
- Upload this new CSV manually in Pigment and map the additional columns on newly created properties
- Save the new import configuration
- You are good to go 🙂 !
Summary
- Create a Google Sheet that will display the historical exchange rates on a given set of currencies using the GOOGLEFINANCE() function.
- Push the FX Rate data to Pigment by using the Google Sheet connector (scope the import by using the Day dimension).
- Create an FX Rate Metric using the data imported in the Transaction List from the Google Sheet and share it in the Library.
- Create a nice Board with clear instructions and a shortcut to the Google Sheet for future updates.
- Use the output FX Rate Metric to convert amount to your reporting currency.
- Update the FX Rate Transaction List load at least once per Month.
- High five to yourself for reading the entire article!!