Have you ever attempted to filter a table by one of its Metric’s values ?
Then this guide might help you figure it out.
Let’s imagine the following use case:
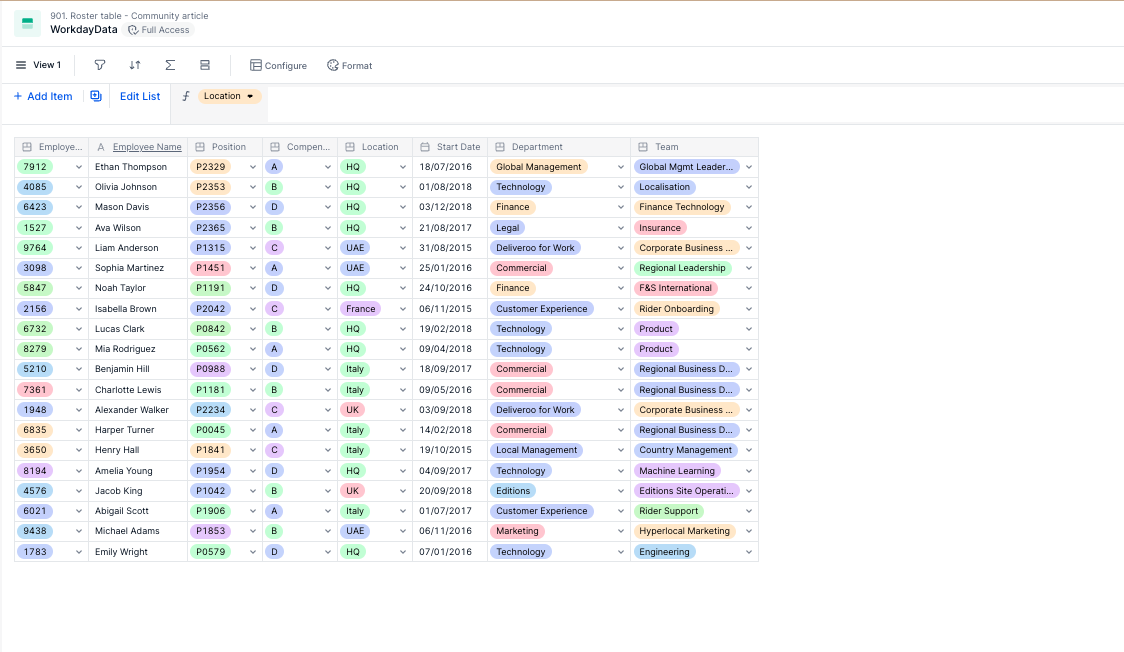
Your Headcount application is built with the following Employee Transaction List imported from Workday:
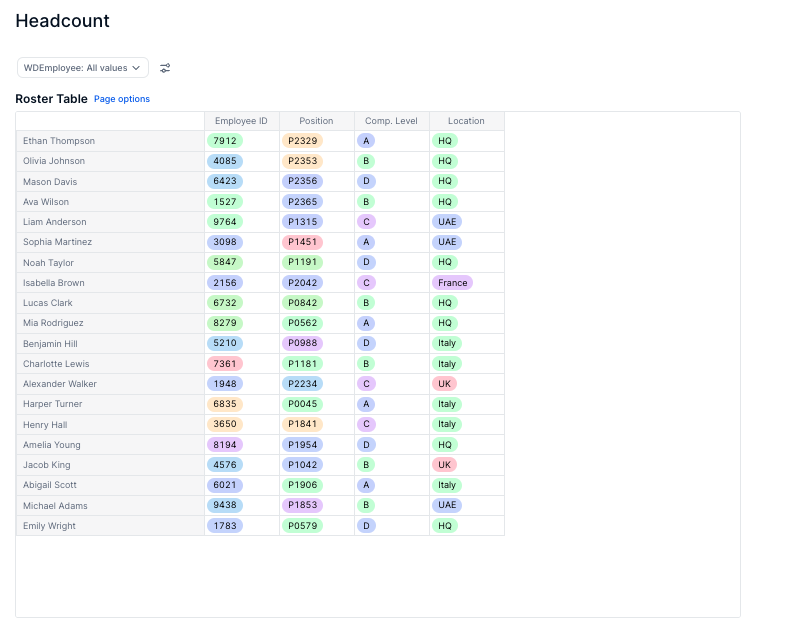
Your CPO has requested to see a table with a simplified view of this Data to easily access the Employee Name, ID, Position, Compensation Level and Location.
Such a table is relatively straightforward to build:
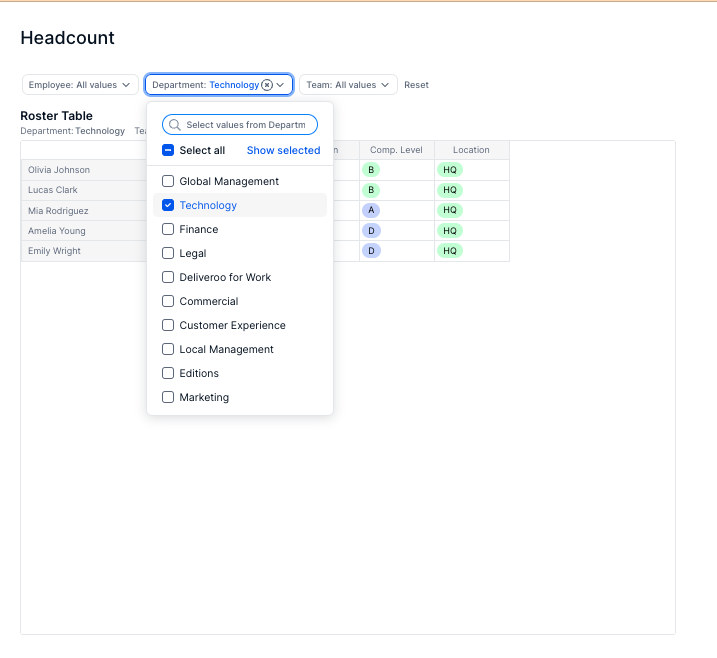
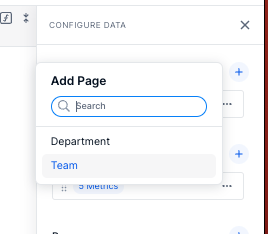
Imagine now that we would also like to filter this table by Department and Team, the same way that we can filter by Employee for instance.
The issue is that Department and Team are Metrics in this Table, and the underlying dimensions are not part of the structure of any other metrics of the Table.
That is why at this stage, the two dimensions Department and Team are not available from the Page Dimensions selectors.
There are 2 available solutions to perform such filtering.
1. The first solution would leverage the View filtering feature available from the Table block itself:
The feature is simple to use, powerful BUT definitely not applicable when it comes to end-user experience:
- not usable directly from the Board but only from the Table block
- too many clicks to change the scope of the filter
Moreover, if another dimension is involved in the Table AND the Metric (for instance the dimension Month as columns), the View Filtering function will also need to specify on which Months the filter should apply to.
2. The second solution involves a bit more work, but the end result totally simplifies the end-user experience from the Board.
a.
Let’s start by creating 2 mapping Metrics:
mapping Employee >> Department
mapping Employee >> Team
The Employee >> Team mapping metric is similar.

b.
Now we need to create a Boolean Metric, structured by the driving dimensions of the Table. In our case:
- Employee
Plus the dimensions we want to bring to the Table and use as Page Dimensions:
- Department
- Team
The purpose of this metric will be to create a mapping between the Table Dimension Employee and the 2 new Dimensions we want to bring up.
The relevant and existing combinations will be represented by the value TRUE in the resulting array.
The computation can be performed using the following formula:

It results in a table providing the existing combinations of Department and Team by Employee:
c.
We can now add this Filter metric to our main table using the Pivot panel:


Adding this filtering Metric to the Table brings the Department and Team Dimensions to the Table structure which allows them to be used from the Page Dimension selector.
Keep in mind that in the table the relation between an Employee and a Department or a Team is only carried out by the Filter Metric at this stage.
In particular, the existing combinations are represented by the value TRUE of the Filter Metric.
d.
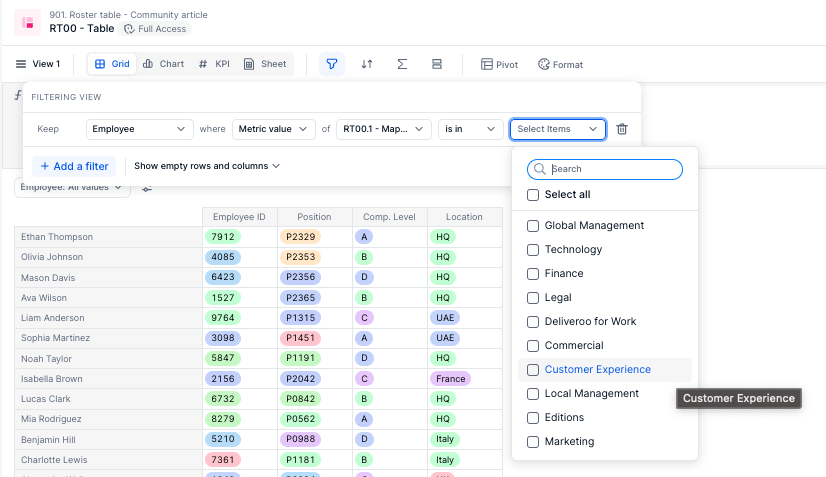
Let’s now use the View Filter function to make sure that the Table only renders the existing solutions (value TRUE of the Filtering Metric):
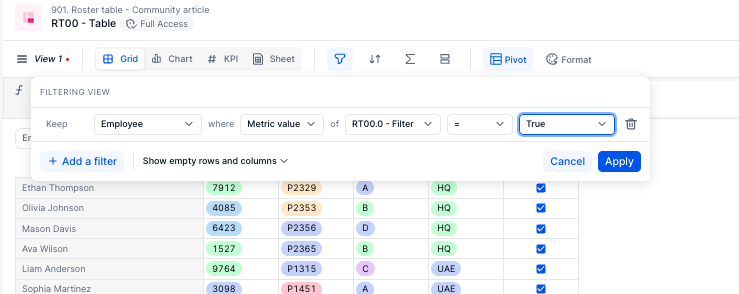
It makes the Table display only the lines for which the selected combinations of Employee/Department/Team are existing (= value TRUE of the Filter metric).
e.
Finally, we can hide the Filter Metric from the table (The filter won’t be affected and will remain):

Bravo !
You can now use the Department or Team Dimensions to filter your data from the Table block, but also directly from the Board!
Note that this setup is limited to Tables structured only with Metrics and no other dimensions in Rows or Columns:
If the table structure also includes another dimension in Rows or Columns (for instance the Metrics in Rows AND the Month dimension in Columns), the View Filter function will need to specify on which Month the filter should be applied.
In that case, this setup is not applicable