
Decisions are only as good as the forecasts behind them. That’s why Pigment provides built-in accuracy measures, enabling you to:
-
Understand how well the model fits your historical data
-
Build trust in the forecasted values
-
Compare multiple models or configurations objectively
-
Choose between simple and advanced forecasting approaches
This article explains the accuracy measures Pigment calculates and their interpretations.
Before you begin
How accuracy is calculated
To evaluate accuracy, Pigment uses a backtesting approach: we hide a portion of historical data (the backtest period) and ask the model to forecast it. We then compare the forecasted values to the actuals using the measures described below.
By default, Pigment uses the first 80% of the dataset to train the model and the last 20% as the backtest period.
Implications of calculating accuracy measures
Calculating accuracy measures requires running the model twice:
-
Once to calculate accuracy as above.
-
A second time to generate the final forecast.
Because of this extra step, the number of forecasted time series and so compute time is doubled.
That’s why accuracy calculation is optional. We recommend enabling it only when you’re evaluating model performance, not for every forecast run.
Which accuracy measures does Predictions calculate?
After accuracy measure calculation is enabled, Predictions calculates two commonly-used forecast accuracy measures:
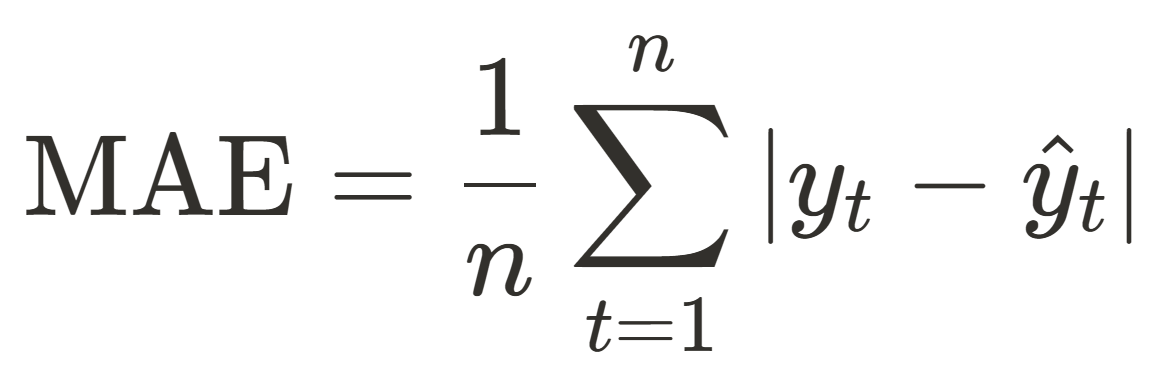
Mean Absolute Error (MAE)
-
Formula:
.png?sv=2022-11-02&spr=https&st=2025-05-27T13%3A28%3A17Z&se=2025-05-27T13%3A40%3A17Z&sr=c&sp=r&sig=BAP18IdFrxjPZmJK%2FLA%2FxTPcp9YHh9%2BdGM5d2bxVQ2c%3D)
-
Example:
Let’s say your actual sales for three weeks aree100, 120, 130]
and your forecasted sales werer90, 100, 130].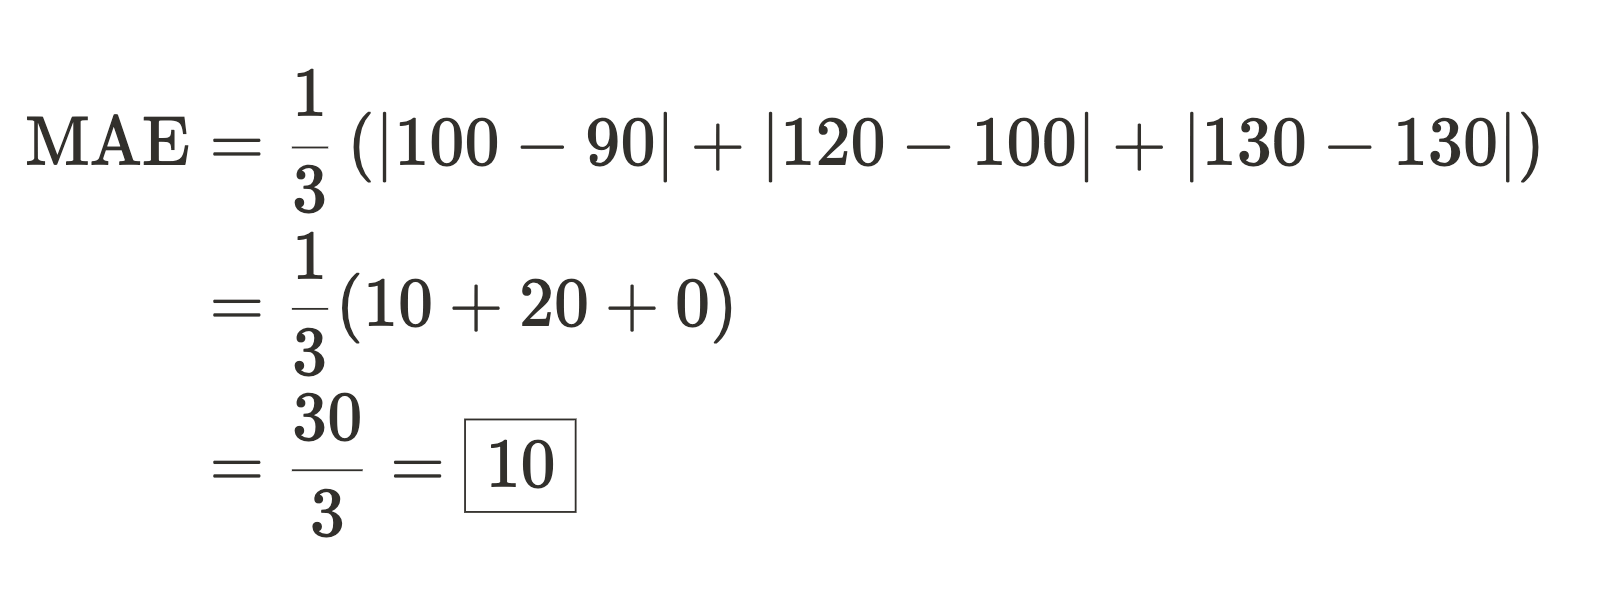
-
Interpretation:
“On average, my forecast is off by 10 units. That’s the typical error I can expect.” -
Application in Pigment:
-
First, Pigment calculates MAE by time series.
-
Then, Pigment calculates the Metric MAE by summing MAE across all time series of the Metric.

-
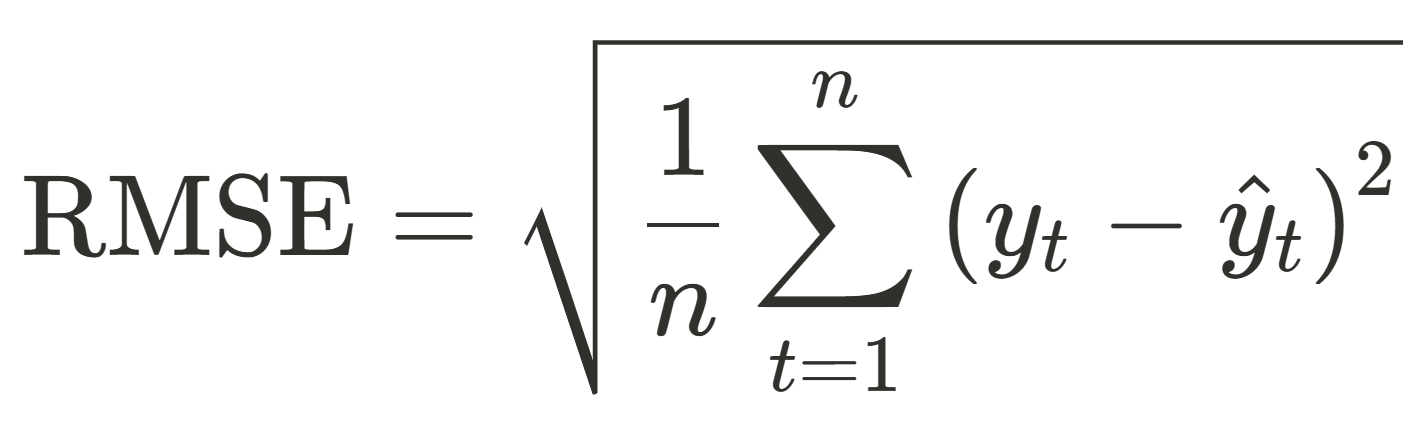
Root Mean Squared Error (RMSE)
-
Formula:
-
Example:
Let’s take the same forecasts and errors as the first example.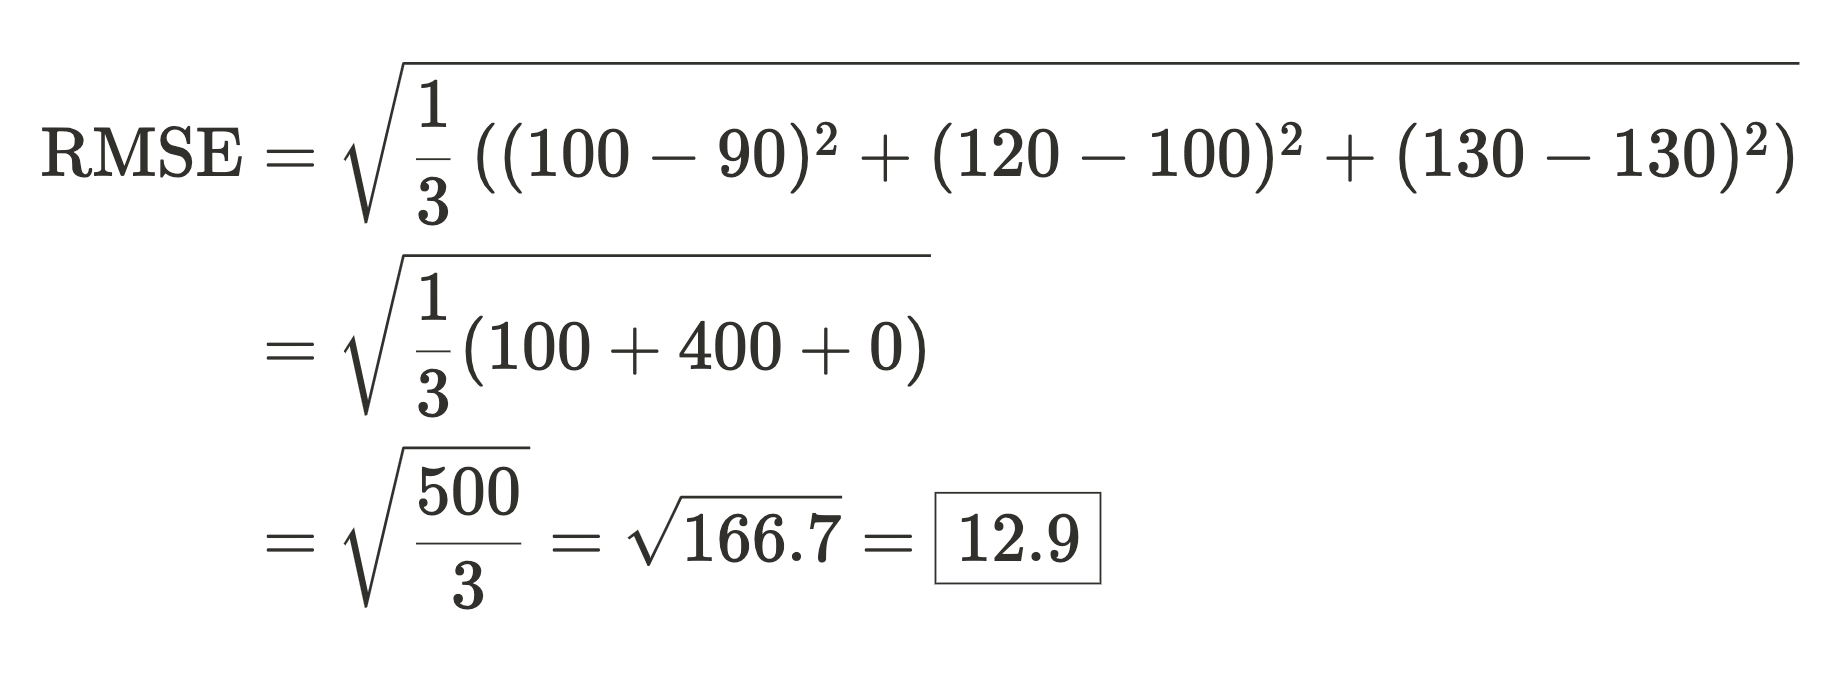
-
Interpretation:
“My forecast is off by about 12.9 units on average. But this test punishes larger mistakes more heavily.” -
Application in Pigment:
-
First, Pigment calculates RMSE by time series.
-
Then, Pigment calculates the Metric RMSE by summing RMSE across all time series of the Metric.

-