Hello. I have created a table with multiple metrics. The calculations work currently, except the percentages are aggregating or calcing oddly when I display the table. When we’re looking at data at NOT the lowest level, the % is incorrect.
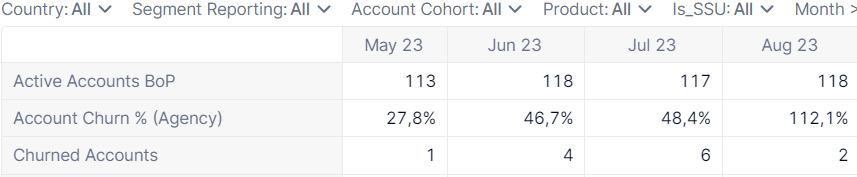
In the screenshot below, I basically want the Account Churn % to display Churned Accounts / Active Accounts BOP. So 1%, 4%, 5% etc. I looked into Calculated Items, but doesn’t seem like that would work in this case. Am not looking to alter the metric itself, but rather to add a row for display purposes only.
Thanks.