I want to dynamically aggregate my data based on the selected time period—whether by month, quarter, or year—using a Boolean metric.
Expected Behavior:
If Month is selected (TRUE), the data should display only monthly values.
If Quarter is selected (TRUE), the data should aggregate and display only quarterly totals.
If Year is selected (TRUE), the data should aggregate at only the yearly level.
How can I achieve this functionality efficiently? Any guidance would be appreciated!
Thanks in advance! 😊
Best answer by oliverlee
Hi @Spandan98, as pointed out by @Min Li Bright Point the challenge is to have a dynamic dimensionality that reacts on filters. My suggestion is to train users in that they will be able to pivot the views so they can switch between months, quarters, and years when they need it. So the data should be kept at the most detailed level required (month), then using properties and pivoting to change views.
That being said, there is also the possibility of using a bit of a weird workaround in such cases by using a shadowing dimension, that would represent a flat list of all time period items of the different dimensions. While this increases the data size, it does that by a max. of +200% (if only a single month of each year has data), but more likely only +40ish % (when each month in a year has data). Still, this should be avoided for larger datasets.
This allows you to provide a single selection of the “Reporting Type” dimension in your board, so the user has to choose between Year, Month, or Quarter. The selection will drive which items will remain present in the views, so they will either see months, quarters or years.
Here are the details:
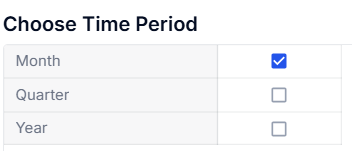
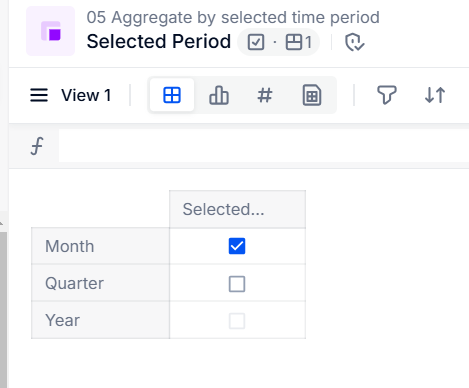
Step 1. Create a “Reporting Type” dimension
Add three items “Month”, “Quarter” and “Year”
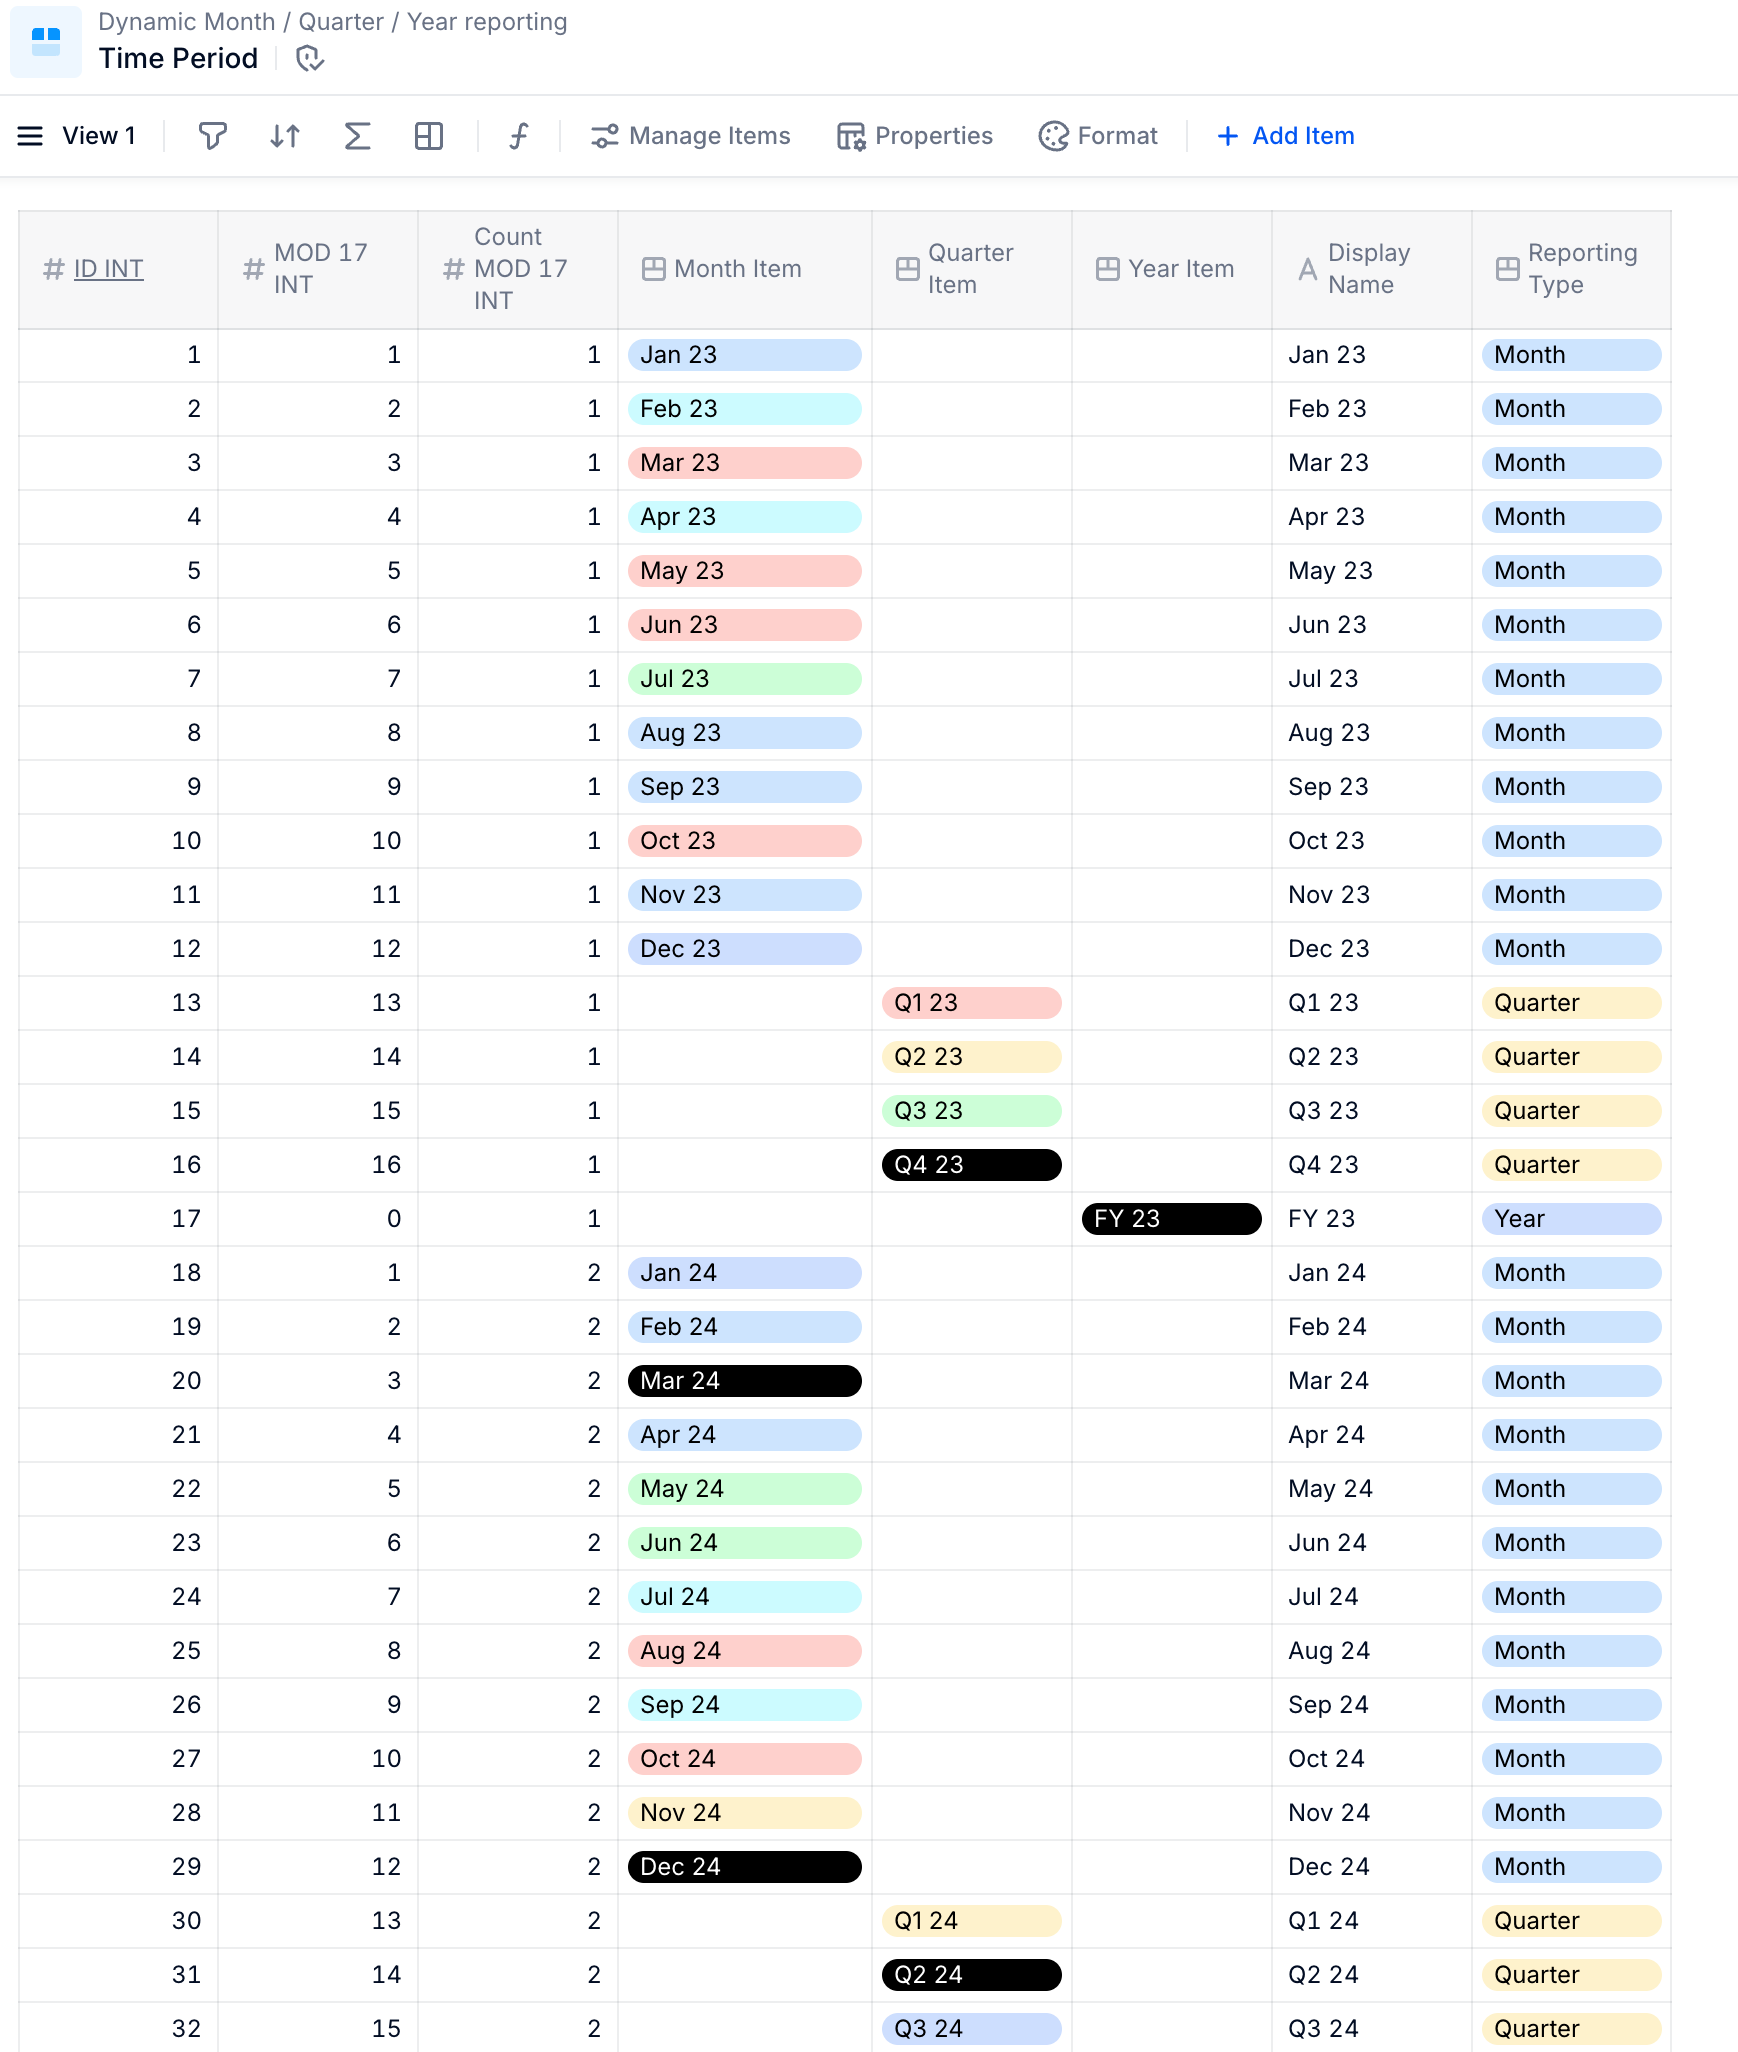
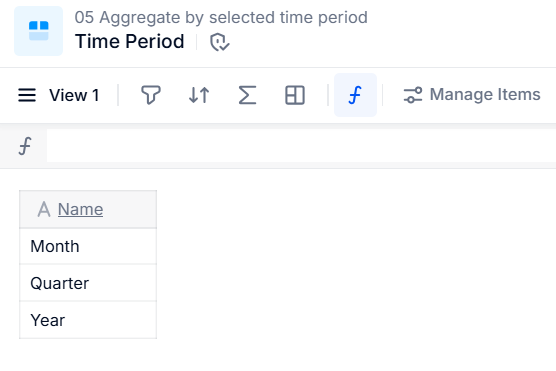
Step 2. Create a “Time Period” Dimension
Add the number of items needed (number of items of year dimension times 17 so that 12 months, 4 quarters, and 1 year are represented) with properties (see property types in the screenshot above) and formulas as follows:
ID INT CUMULATE(1, 'Time Period')
MOD 17 INT MOD('Time Period'.'ID INT', 17)
Count MOD 17 INT CUMULATE(1, 'Time Period', 'Time Period'.'MOD 17 INT')
Month Item
IF(
  'Time Period'.'MOD 17 INT' >= 1 AND 'Time Period'.'MOD 17 INT' <= 12,
  SHIFT(
    Month[remove firstnonblank: Month],
    ('Time Period'.'MOD 17 INT' - 1) +(12 * ('Time Period'.'Count MOD 17 INT' - 1) )
    )
  )
Quarter Item
IF(
  'Time Period'.'MOD 17 INT' >= 13 AND 'Time Period'.'MOD 17 INT' <= 16,
  SHIFT(
    Quarter[remove firstnonblank: Quarter],
    ('Time Period'.'MOD 17 INT' - 13) +(4 * ('Time Period'.'Count MOD 17 INT' - 1) )
    )
  )
Year Item
IF(
  'Time Period'.'MOD 17 INT' = 0,
  SHIFT(
    Year[remove firstnonblank: Year],
    ('Time Period'.'Count MOD 17 INT' - 1)
    )
  )
Step 3. Create metric for Quarter and one for Year
'Data Source Metric 01 (by Month)' is where my original data is in, then I create 'Data Source Metric 02 (by Quarter)' and 'Data Source Metric 03 (by Year)' for which we use the formulas 'Data Source Metric 01 (by Month)'[BY: Month.Quarter] or 'Data Source Metric 01 (by Month)'[BY: Month.Year], respectively.
Step 4. Create metric by Time Period that combines the other data sources
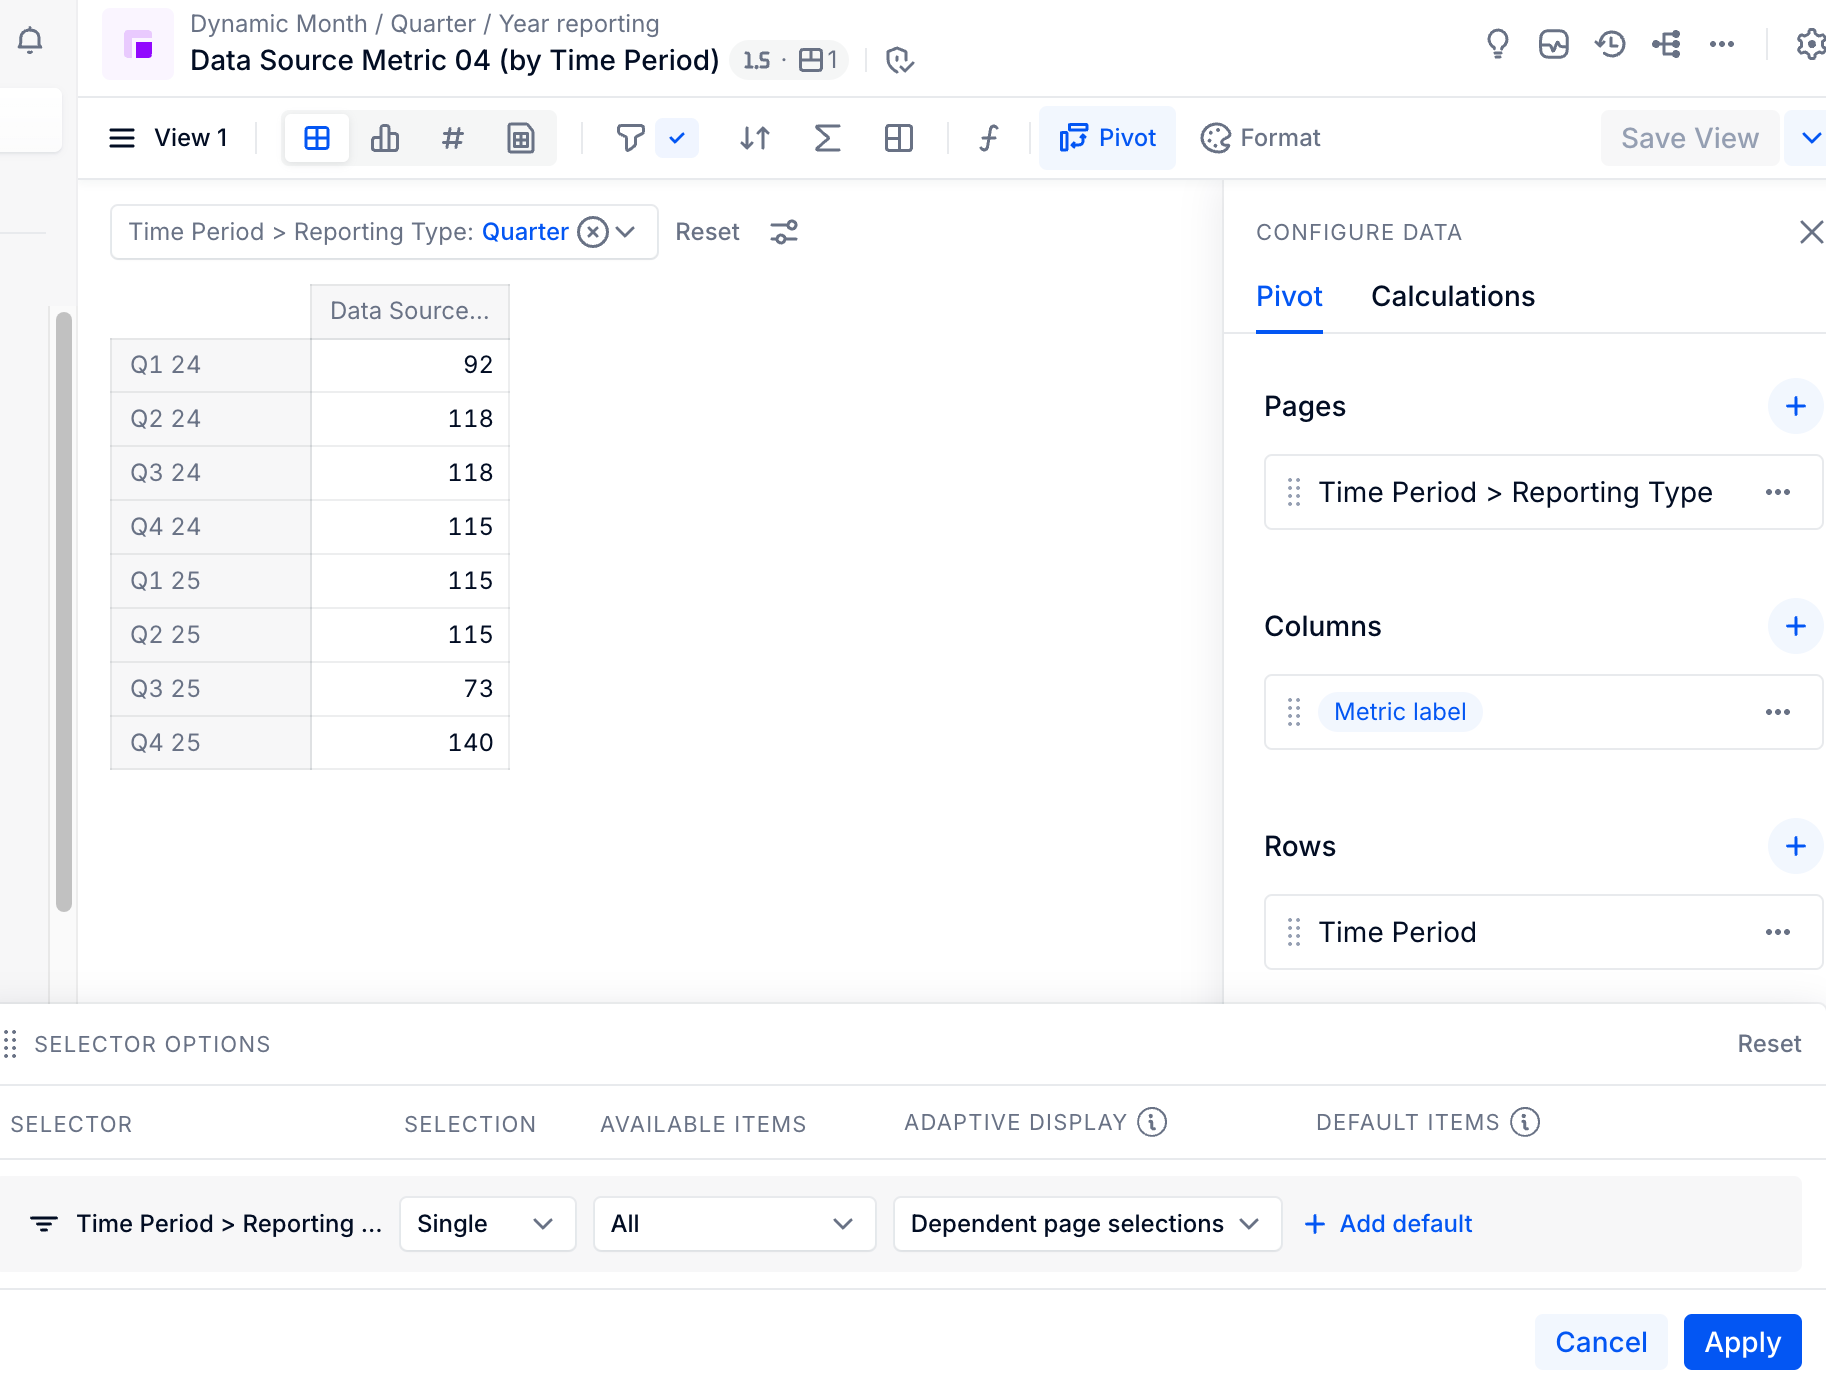
My metric is called 'Data Source Metric 04 (by Time Period)' and I use the formula
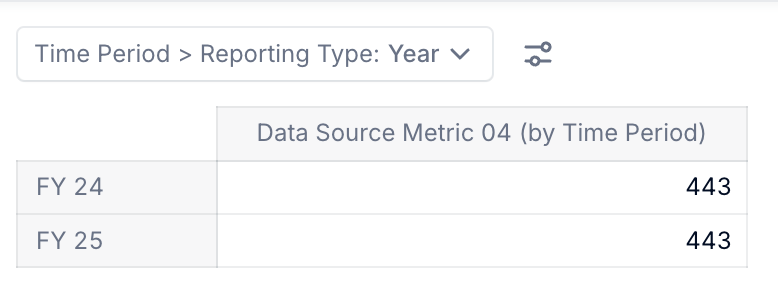
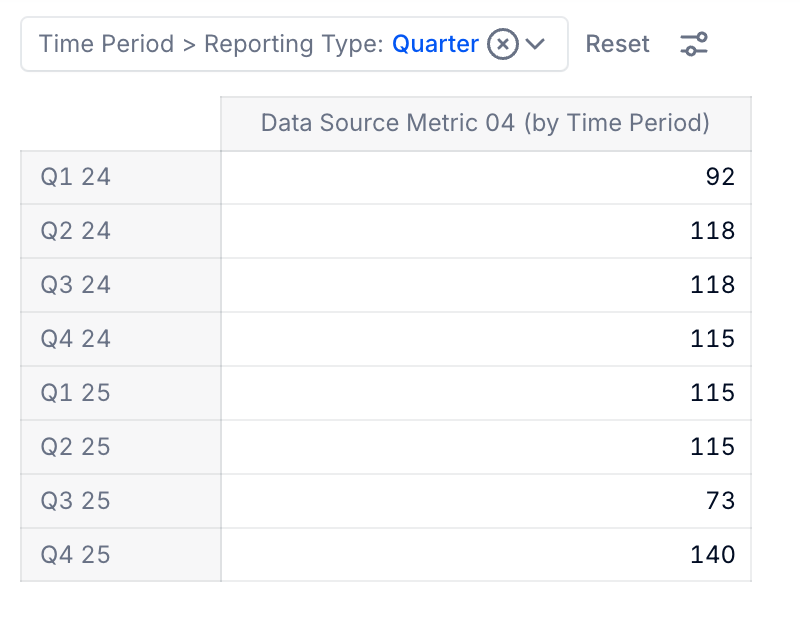
Final Step. Provide single selector for Reporting Type in View
Place your Time Period dimension in rows or columns, add the Reporting Type dimension to pages, and make sure it is a single selection via Pages options.
Hi @Spandan98, as pointed out by @Min Li Bright Point the challenge is to have a dynamic dimensionality that reacts on filters. My suggestion is to train users in that they will be able to pivot the views so they can switch between months, quarters, and years when they need it. So the data should be kept at the most detailed level required (month), then using properties and pivoting to change views.
That being said, there is also the possibility of using a bit of a weird workaround in such cases by using a shadowing dimension, that would represent a flat list of all time period items of the different dimensions. While this increases the data size, it does that by a max. of +200% (if only a single month of each year has data), but more likely only +40ish % (when each month in a year has data). Still, this should be avoided for larger datasets.
This allows you to provide a single selection of the “Reporting Type” dimension in your board, so the user has to choose between Year, Month, or Quarter. The selection will drive which items will remain present in the views, so they will either see months, quarters or years.
Here are the details:
Step 1. Create a “Reporting Type” dimension
Add three items “Month”, “Quarter” and “Year”
Step 2. Create a “Time Period” Dimension
Add the number of items needed (number of items of year dimension times 17 so that 12 months, 4 quarters, and 1 year are represented) with properties (see property types in the screenshot above) and formulas as follows:
ID INT CUMULATE(1, 'Time Period')
MOD 17 INT MOD('Time Period'.'ID INT', 17)
Count MOD 17 INT CUMULATE(1, 'Time Period', 'Time Period'.'MOD 17 INT')
Month Item
IF(
  'Time Period'.'MOD 17 INT' >= 1 AND 'Time Period'.'MOD 17 INT' <= 12,
  SHIFT(
    Month[remove firstnonblank: Month],
    ('Time Period'.'MOD 17 INT' - 1) +(12 * ('Time Period'.'Count MOD 17 INT' - 1) )
    )
  )
Quarter Item
IF(
  'Time Period'.'MOD 17 INT' >= 13 AND 'Time Period'.'MOD 17 INT' <= 16,
  SHIFT(
    Quarter[remove firstnonblank: Quarter],
    ('Time Period'.'MOD 17 INT' - 13) +(4 * ('Time Period'.'Count MOD 17 INT' - 1) )
    )
  )
Year Item
IF(
  'Time Period'.'MOD 17 INT' = 0,
  SHIFT(
    Year[remove firstnonblank: Year],
    ('Time Period'.'Count MOD 17 INT' - 1)
    )
  )
Step 3. Create metric for Quarter and one for Year
'Data Source Metric 01 (by Month)' is where my original data is in, then I create 'Data Source Metric 02 (by Quarter)' and 'Data Source Metric 03 (by Year)' for which we use the formulas 'Data Source Metric 01 (by Month)'[BY: Month.Quarter] or 'Data Source Metric 01 (by Month)'[BY: Month.Year], respectively.
Step 4. Create metric by Time Period that combines the other data sources
My metric is called 'Data Source Metric 04 (by Time Period)' and I use the formula
Final Step. Provide single selector for Reporting Type in View
Place your Time Period dimension in rows or columns, add the Reporting Type dimension to pages, and make sure it is a single selection via Pages options.