Hi Pigment Community,
Hope you’re all doing well. I’m currently having a formatting/metric structure issue and was wondering if anyone had a solution to my problem.
The current challenge I’m facing is that when I create a table using 2 existing metrics and 1 input metric, the format of my table follows the input metric, when I would like it to follow the format of the existing metrics. To further explain I have a list of managers and territories. Managers only operate in one territory, so in a table manager A should only be seen under country X, however I am seeing that Manager A is listed under Country A, B, C, etc...
Blocks:
- DIMENSION: Opp Owner Name
- METRIC: Revenue [$] Y-1
- METRIC: Revenue [$] Y-2 (no picture provided because its the same as Revenue [$] Y-1)
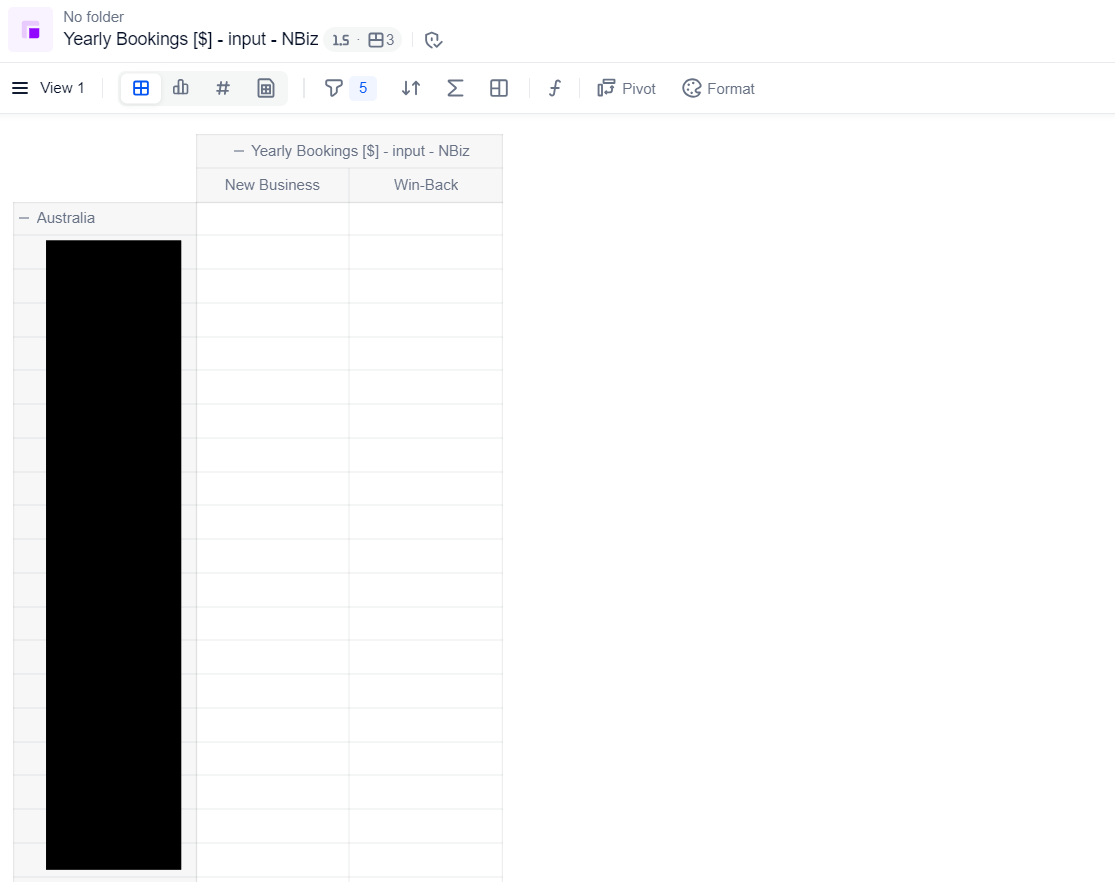
- METRIC: Yearly Bookings [$] - Input - NBiz
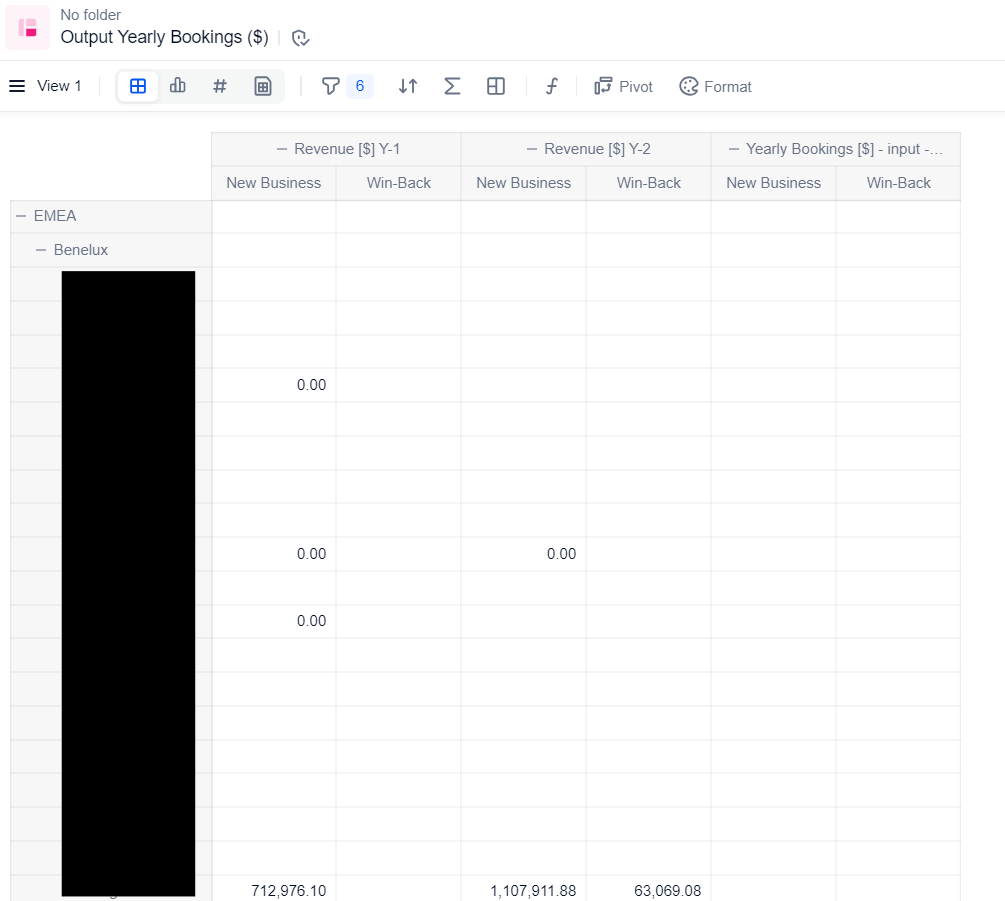
- TABLE: Output Yearly Bookings ($)
To help explain I have attached images below that walk you through the issue I am facing.
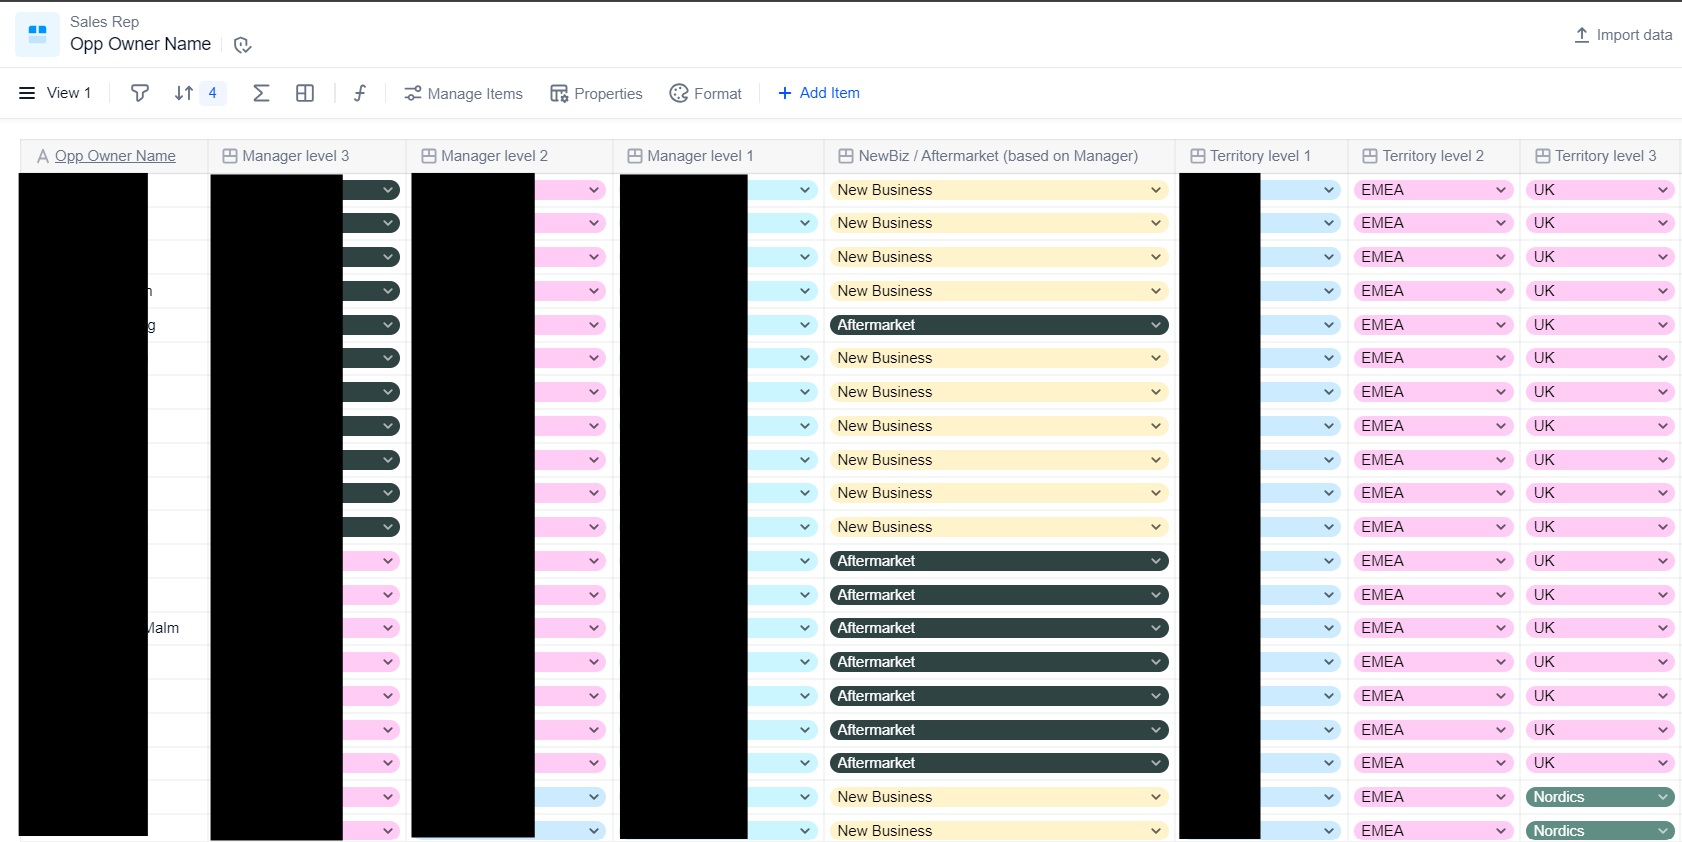
The first image “Opp Owner Name” shows a dimension that has a mapping between managers and territories. This mapping is used to have managers displayed under the correct countries.
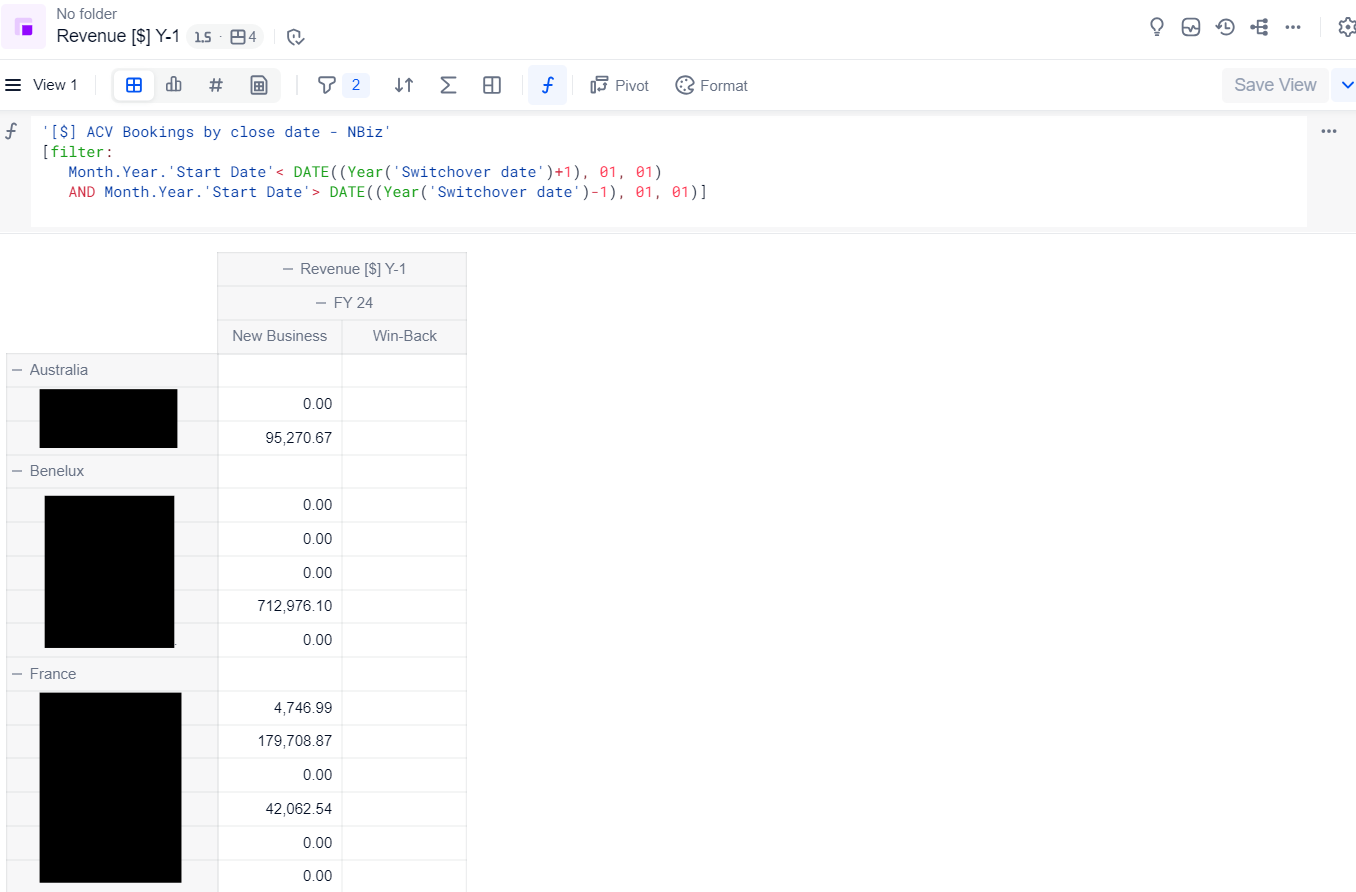
This metric, “Revenue [$] Y-1”, shows the total revenue from the previous year. It will be used as a gauge for the user to determine what the input should be. Note that here each manager is under the correct country and the manager is not repeating under each country.
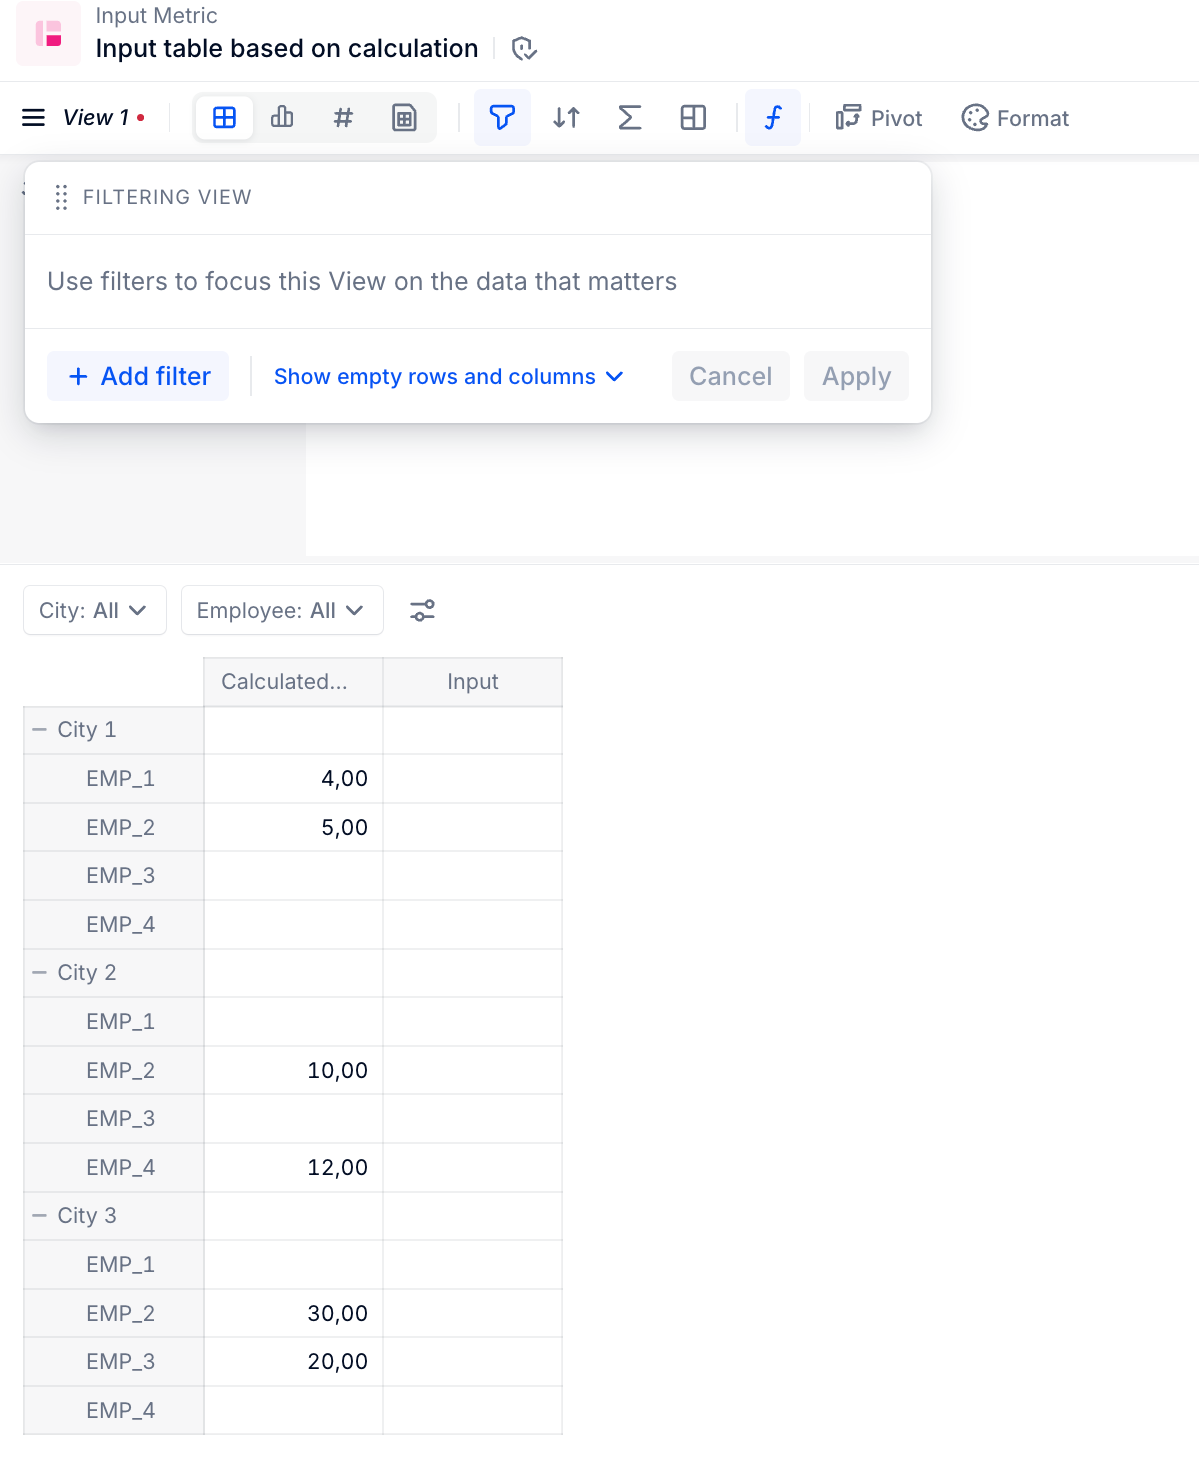
This metric, “Yearly Bookings [$] - input - NBiz”, is a blank metric that the user will input revenue projections into. Inputted values will be used for calculations in the future. Here you can see that the metric shows every single manager under the country australia, this problems repeats for every
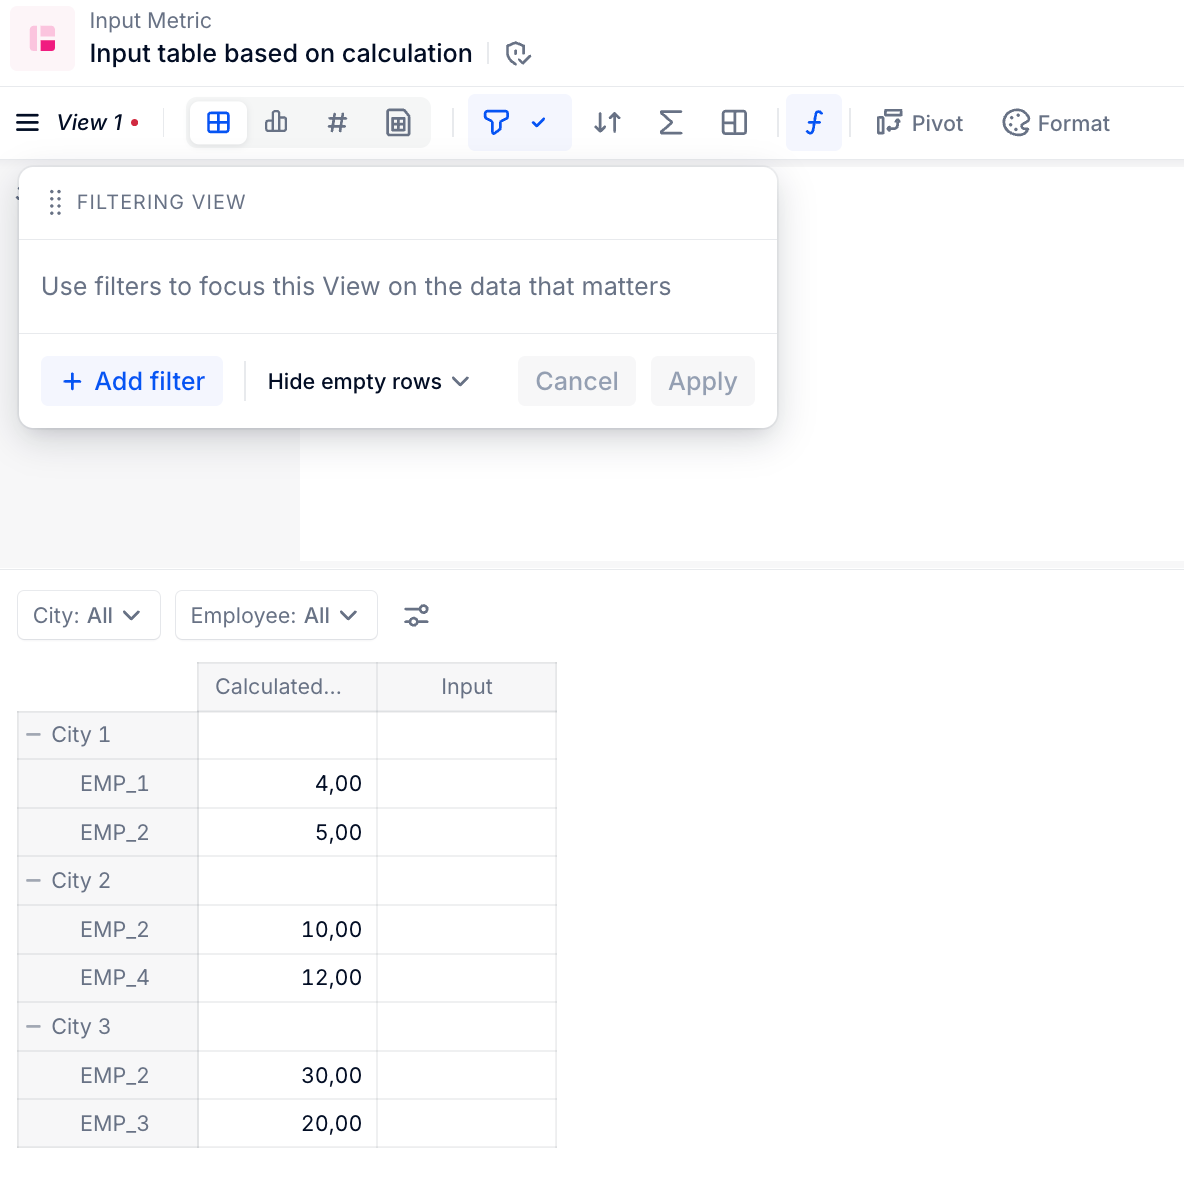
The table below, “Output Yearly Bookings ($)”, brings the 3 metrics together. under the third column the user will input their reveune. However, you can see that the table is following the format of the Input metric and not the Y-1 metric.
Thank you for the help!
Darious