Hello Everyone !
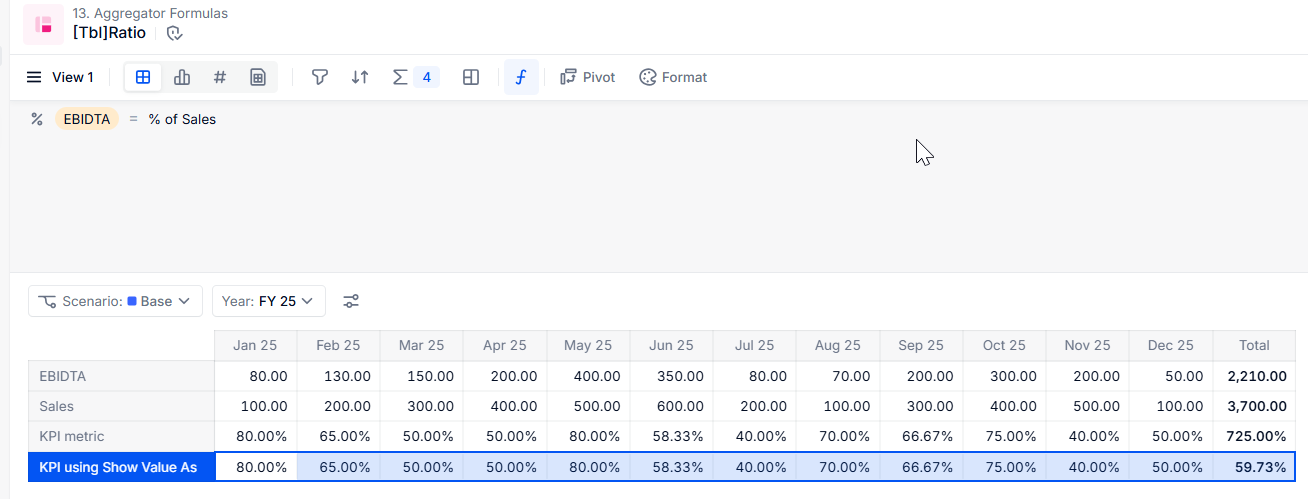
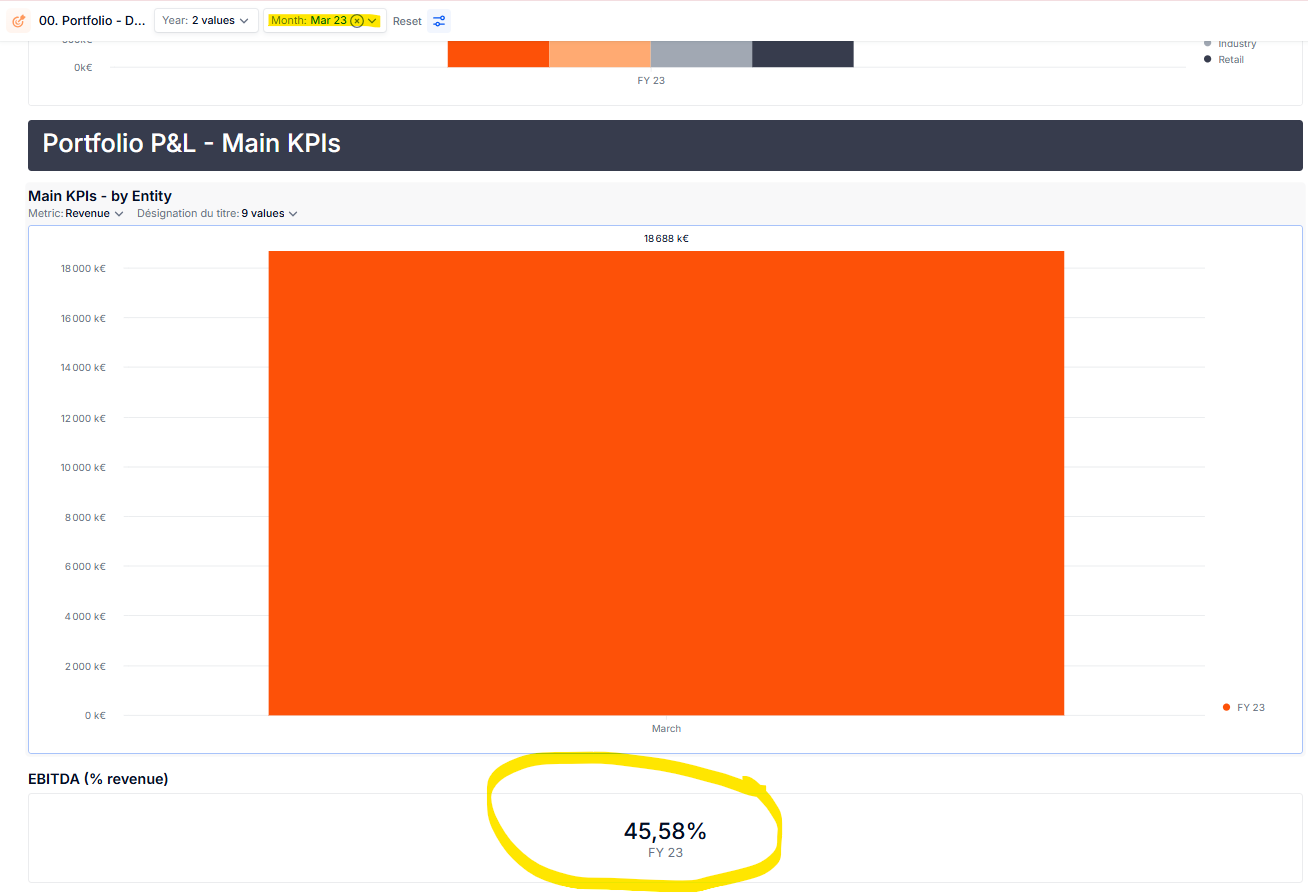
I have created a metric which will calculate a simple EBITDA/Net Sales ratio, which is as followed:
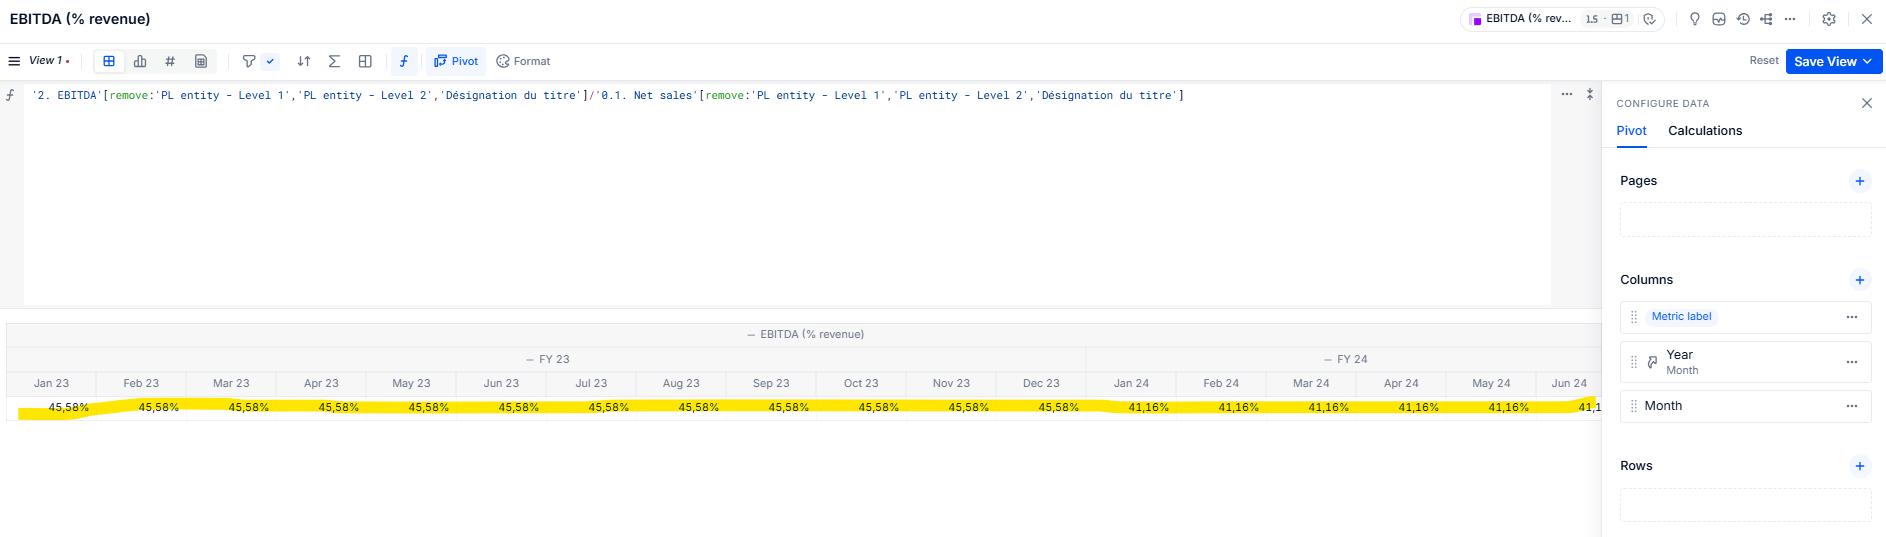
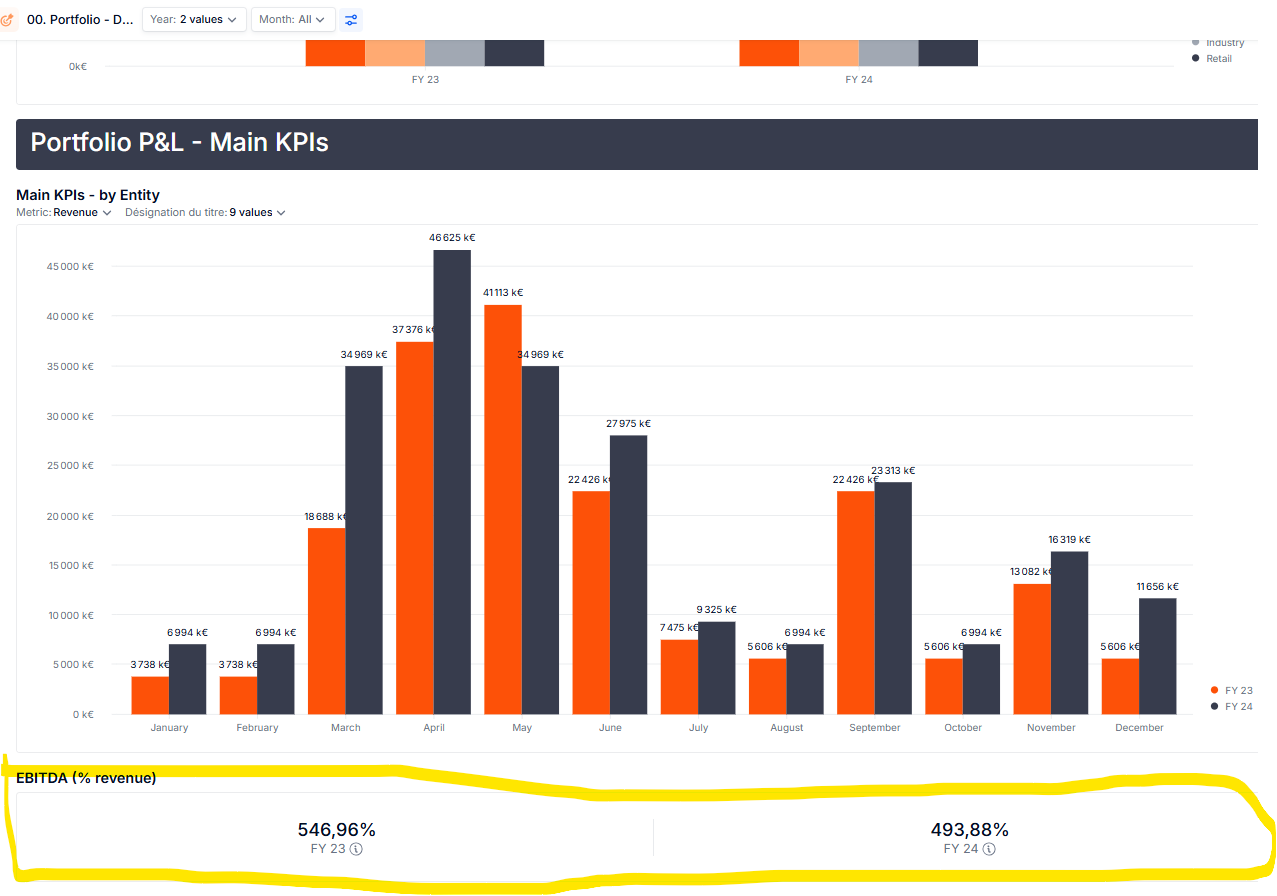
I want to be able to switch to a yearly view easily. The issue is that when I pivot the table to show yearly data, it aggregates all the months instead of displaying the ratio between yearly EBITDA and yearly Net Sales. I need it to show the correct yearly ratio, not just a sum of monthly values.
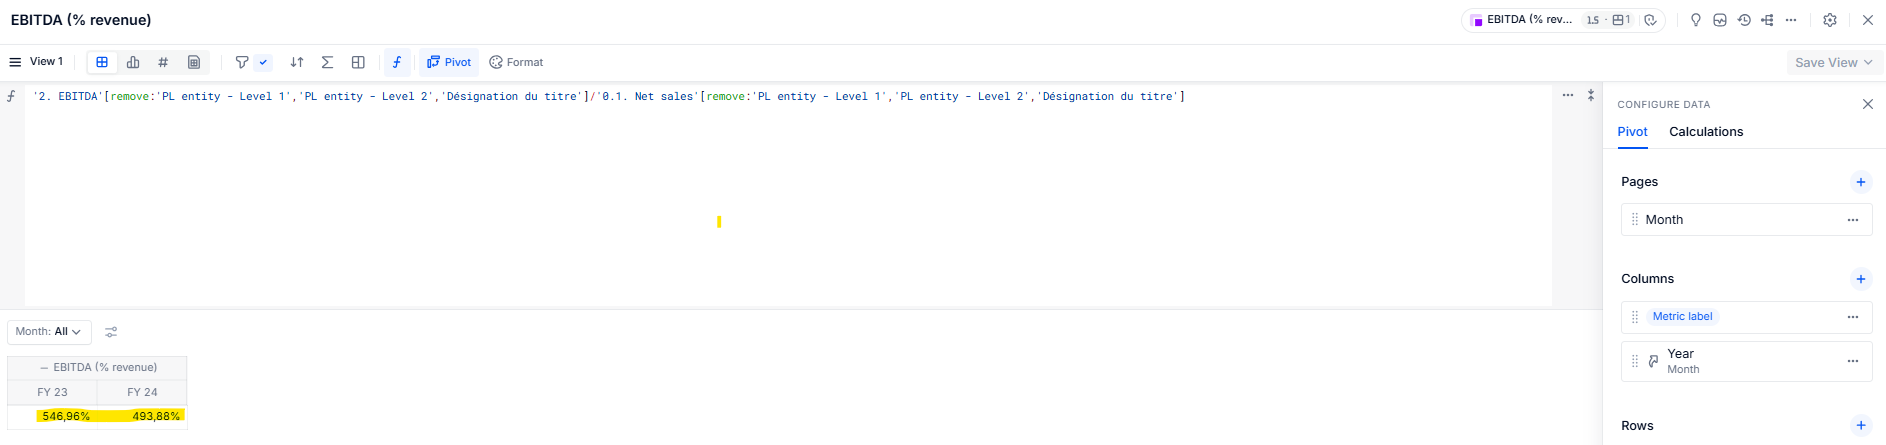
Is there a way to prevent aggregation and ensure that the metric correctly calculates the yearly ratio ? I want to ensure it’s possible to switch views while keeping the same metric. Ultimately, the goal is to use this metric in a board and apply a page selector to display the desired month as a KPI..
Thank you by advance for your help 🙂
Yacine