Question

Growth Rates

  • February 23, 2026
  • 2 replies
  • 24 views

Forum|alt.badge.img+3

Hi,

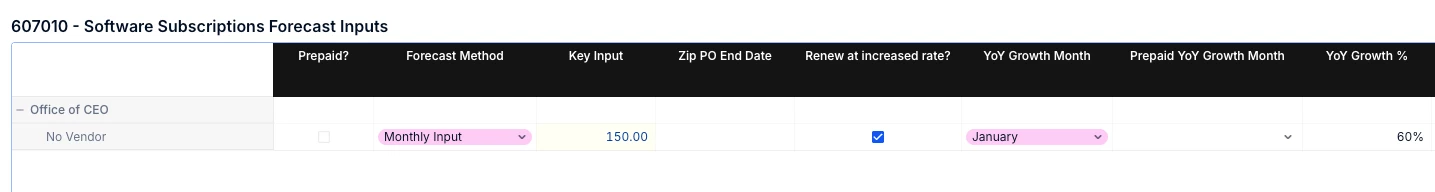
I want to be able properly forecast the growth rate through time. Right now for Software, we select what month we’d like to grow the monthly cost and by what %. I’d like the formula to work as following:

If the month is in an actual period, don’t grow the software period until the following year (example: if we had a software planned to grow in January, for 2026 we wouldnt see any growth but in January 2027 we would see the growth rate).

Right now we have a super complex formula that really slows down the model:


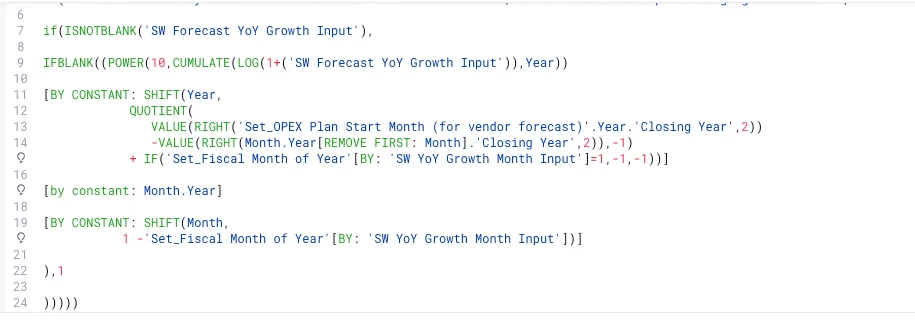
is there a more simplified way to calculate a growth rate %? Below are screenshots for an example calc based on the formula above:


thank you in advance for all of the help!

2 replies

KeeganSF
Employee
Forum|alt.badge.img+2
  • Employee
  • February 24, 2026

Hey Caitlin,


The complexity and performance issues you're seeing are common when compounding logic, string-based date parsing, and multiple SHIFT/BY CONSTANT layers are all packed into a single formula.

A few recommendations:

  • Break the formula into 2–3 intermediate metrics (e.g., one to flag the growth month, one to track the cumulative growth count, one to calculate the multiplier). This is the best performance improvement and will make it much easier to debug.
  • Use native dimension properties like Month.'Month of Year' and Month.Year instead of VALUE(RIGHT(...)) string parsing — it's both faster and more readable.
  • Replace the LOG/POWER/CUMULATE compounding trick with Pigment's POWER() function directly — e.g., POWER(1 + growth rate, number of growth periods) is much simpler and achieves the same result.
  • Use your actuals/forecast flag to control when the growth count starts incrementing — this naturally handles the "don't grow until the next forecast year" requirement.

For a foundational pattern to build from, check out:


Hope this helps point you in the right direction! 

!-->


CDALMAY
Master Helper
Forum|alt.badge.img+16
  • Master Helper
  • February 25, 2026

Hi @caitlinharrington,

I ran into the same issue, as the growth formula from the OpEx template was taking longer and was hard to debug (I think that’s the one you have).

Instead, what I did is the following :

  • Create a metric VP_Calc_03_Growth_Yearly_No_Compound (With the following dimensions vendor/department/account)
IF(ISDEFINED(VP_Input_Amount),
1[ADD:Year]
)+VP_Input_Growth_%[ADD:Year][FILTER:Year>=Set_Last_Actuals_Month_Netsuite.Year]

Where VP_Input_Amount is the original amount, VP_Input_Growth_% is the growth increase as a % and Set_Last_Actuals_Month_Netsuite your last actual month.

  • Create a metric VP_04_Calc_Growth_Yearly_Compound :
IF(ISDEFINED(VP_Calc_03_Growth_Yearly_No_Compound[SELECT:Year-1]),
VP_Calc_03_Growth_Yearly_No_Compound*PREVIOUS(Year),
VP_Calc_03_Growth_Yearly_No_Compound
)
  • Create a last metric VP_05_Calc_Growth_% :
VP_Calc_04_Growth_Yearly_Compound
[BY:Month.Year]
[BY CONSTANT:
SHIFT(Month,
1-VP_Input_Growth_Month.Id-(IF(Set_Last_Actuals_Month_Netsuite.'Month of Year'.Id >= VP_Input_Growth_Month.Id,12)))
]//ID is the month # out of 12; i.e. if growth month is June but it is currently Sept 25, shift to next year June 26

Where VP_Input_Growth_Month is the month in which the growth should occur.

You can then use this % metric to calculate the forecasted data.

Hope this helps,