How do I get a unique count of months in a metric in a view?
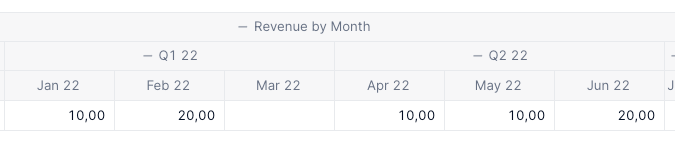
For instance, I have Revenue (Dim: Month):
Jan23 : 10
Feb23 : 15
Mar 23 : 20
I’m looking at this metric in a quarterly view, Month > Quarter and I want to annualize this number. So the math would be (10 + 15 + 20) * 12/(3) (3 months in this time frame). I want this to recalc when I view it from a yearly perspective so it would be 12 months. Any ideas on this?
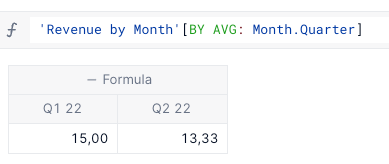
I tried doing Revenue [REMOVE COUNTUNIQUE: Month] but that just found the number of uniques in my Month Dim List and multiplied by that.