Solved

Max - All Time High table

  • April 23, 2025
  • 2 replies
  • 90 views

Forum|alt.badge.img+8

Hello Pigment team, 


I am trying to build a simple table that shows All-Time-High result based on the report. 

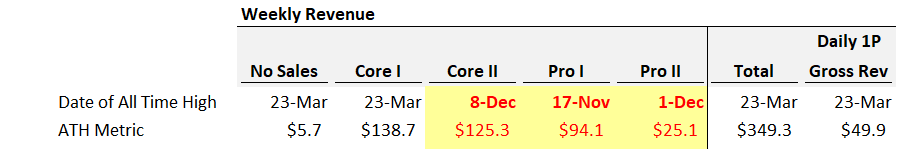
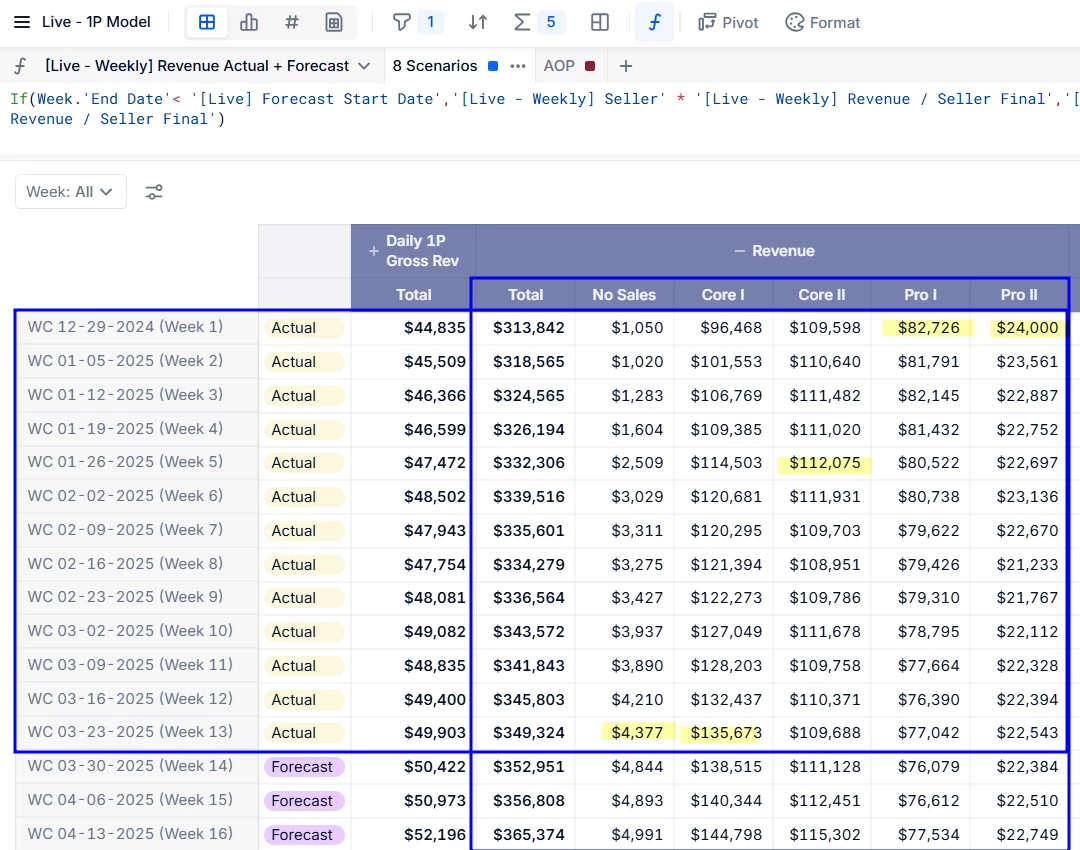
As shown below, there are multiple segments (No Sales, Core I, Core II, etc) and each reached highest (i.e. max) in different period (highlighted in yellow. 

Based on Period Type: Actual only, I would like to show 1) highest number for each segment and 2) highest date. I assume i need to create two different metrics and combine in a table. Is my approach right?


The table setting would be something like this:

(Please note, the values below will not match with the values above highlighted cells) 


Best answer by gablahoz

That’s correct, you’ll need two separate metrics combined in one table. The formulas could look like:

Metric_1: Revenue_Metric[FILTER: Condition_or_Boolean_for_Actual_Week][REMOVE MAX: Week_Dimension]

Metric_2: IF(Revenue_Metric[FILTER: Condition_or_Boolean_for_Actual_Week] = Metric_1, Week_Dimension)[REMOVE LASTNONBLANK: Week_Dimension]

2 replies

Forum|alt.badge.img+8
  • Answer
  • April 23, 2025

That’s correct, you’ll need two separate metrics combined in one table. The formulas could look like:

Metric_1: Revenue_Metric[FILTER: Condition_or_Boolean_for_Actual_Week][REMOVE MAX: Week_Dimension]

Metric_2: IF(Revenue_Metric[FILTER: Condition_or_Boolean_for_Actual_Week] = Metric_1, Week_Dimension)[REMOVE LASTNONBLANK: Week_Dimension]


Forum|alt.badge.img+8
  • Author
  • Master Author
  • April 23, 2025

Thank you!!