Solved

Show calculated item comparing 2 scenarios on a chart while removing the source metric

  • March 8, 2025
  • 5 replies
  • 127 views

Forum|alt.badge.img+1

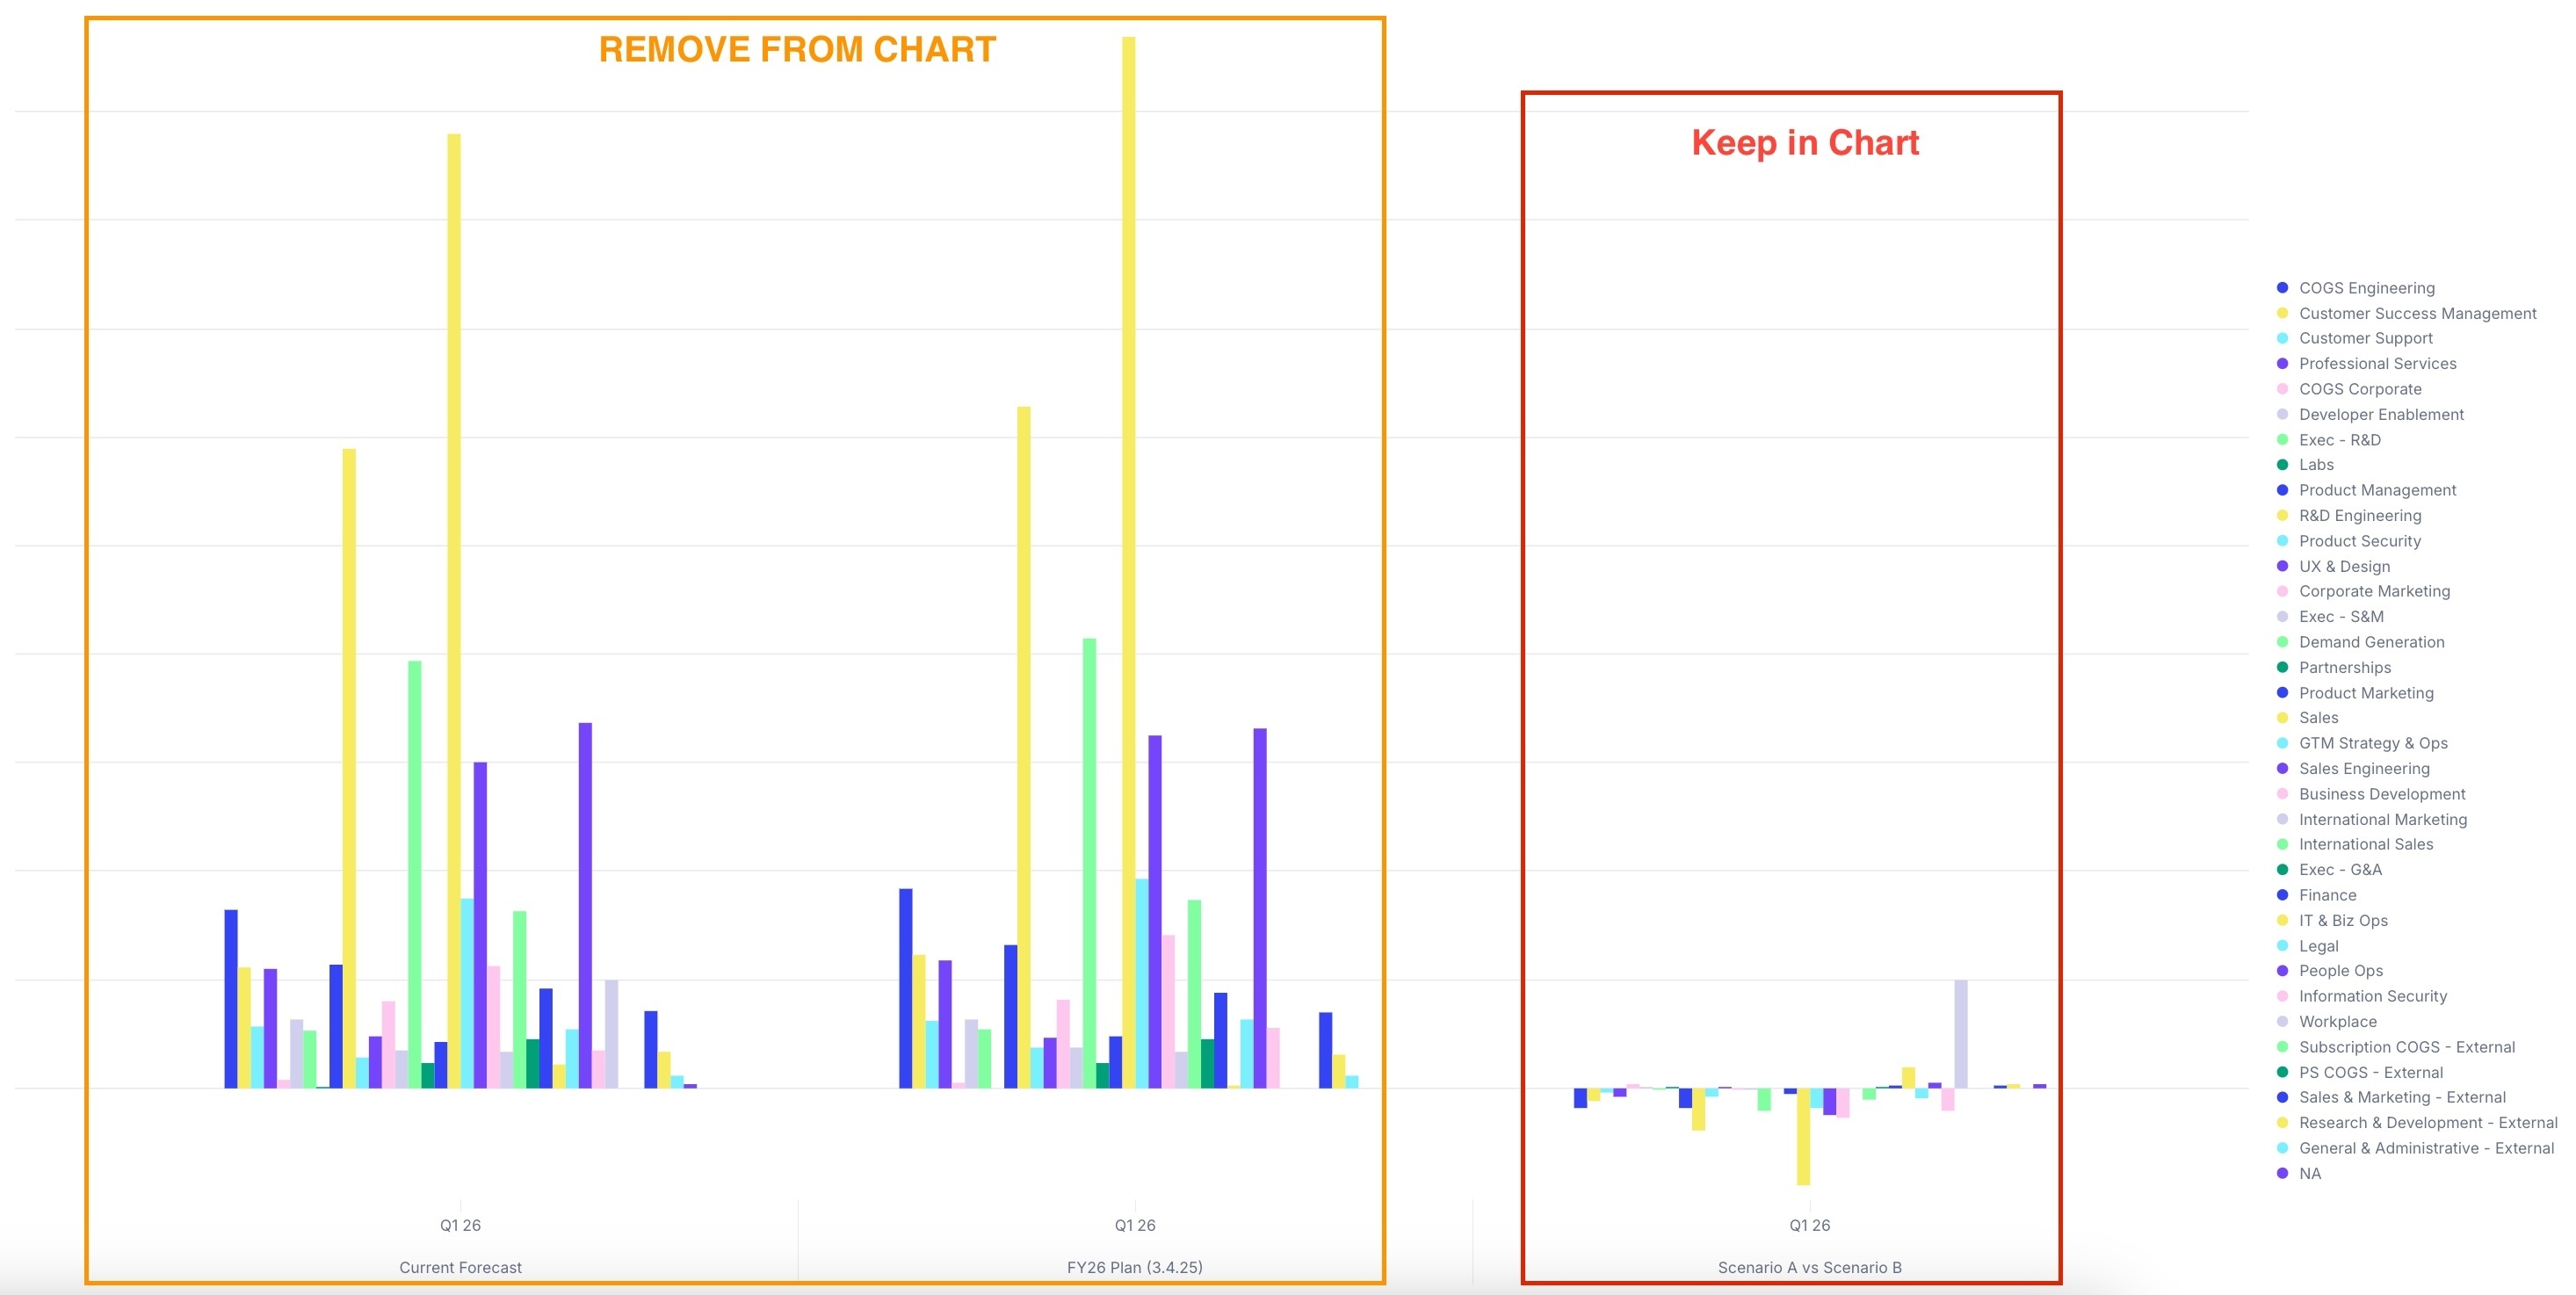
I want to show a calculated item that takes the difference (A-B) of two scenarios on a chart, but remove the underlying metric that it is calculated from. I have tried using ‘show values as’ vs calculated item but there’s no option to show value as the difference of two scenarios. I also tried duplicating the metric and multiplying the duplicated metric by -1 to offset the initial metric via show value as > difference of metric, but this removes everything including the calculated item. I also tried the filter workaround as explained here, but this also removed everything including the calculated item. Any help here would be appreciated!


Best answer by gablahoz

Hey Chris, here’s a hacky workaround:
1. Create a duplicate metric in the security folder (or another application without scenarios). This forces that metric to always be selected on the Current Forecast scenario
2. Create a variance metric = ‘Original Metric’ - ‘Duplicate Metric in the Security Folder’. Page select on your Plan Scenario, and you can now chart just this variance metric.

The limitation of this workaround is you are always comparing against the Current Forecast scenario (but this is often the case anyways).

5 replies

Min Li
Master Helper
Forum|alt.badge.img+12
  • Master Helper
  • March 10, 2025

You can try to use Version (Dimension) instead of Scenario to create a calculated item for the difference between two items under dimension Version.


Forum|alt.badge.img+1

Hi Min Lee - we did not opt to use a Versions dimension and instead chose to run all BVAs and comparisons through Scenarios, so inserting this dimension would cause a lot of downstream impacts and refactoring in our model. Wondering if a workaround exists for this given that we did not build using Versions


Forum|alt.badge.img+8
  • Answer
  • March 12, 2025

Hey Chris, here’s a hacky workaround:
1. Create a duplicate metric in the security folder (or another application without scenarios). This forces that metric to always be selected on the Current Forecast scenario
2. Create a variance metric = ‘Original Metric’ - ‘Duplicate Metric in the Security Folder’. Page select on your Plan Scenario, and you can now chart just this variance metric.

The limitation of this workaround is you are always comparing against the Current Forecast scenario (but this is often the case anyways).


CDALMAY
Master Helper
Forum|alt.badge.img+14
  • Master Helper
  • March 13, 2025

Hi ​@gablahoz ,

That’s a really nice workaround !
I forgot the Security Folder couldn’t handle scenario so it “forces” metric to select the Default/Current Forecast Scenario.
However, as you mentioned, it will always compare against Current Forecast Scenario, but that’s the only caveat, and not too constraining. 
Thanks for the tips


Forum|alt.badge.img+1

Agreed with ​@CDALMAY this is a good workaround! Thanks ​@gablahoz !