
Hi Pigment,


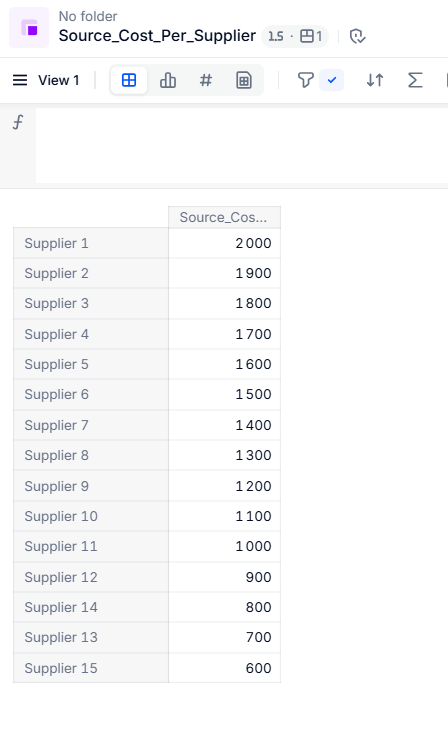
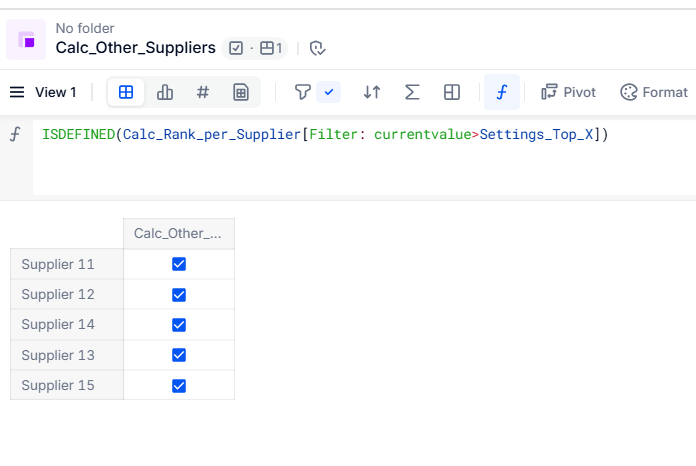
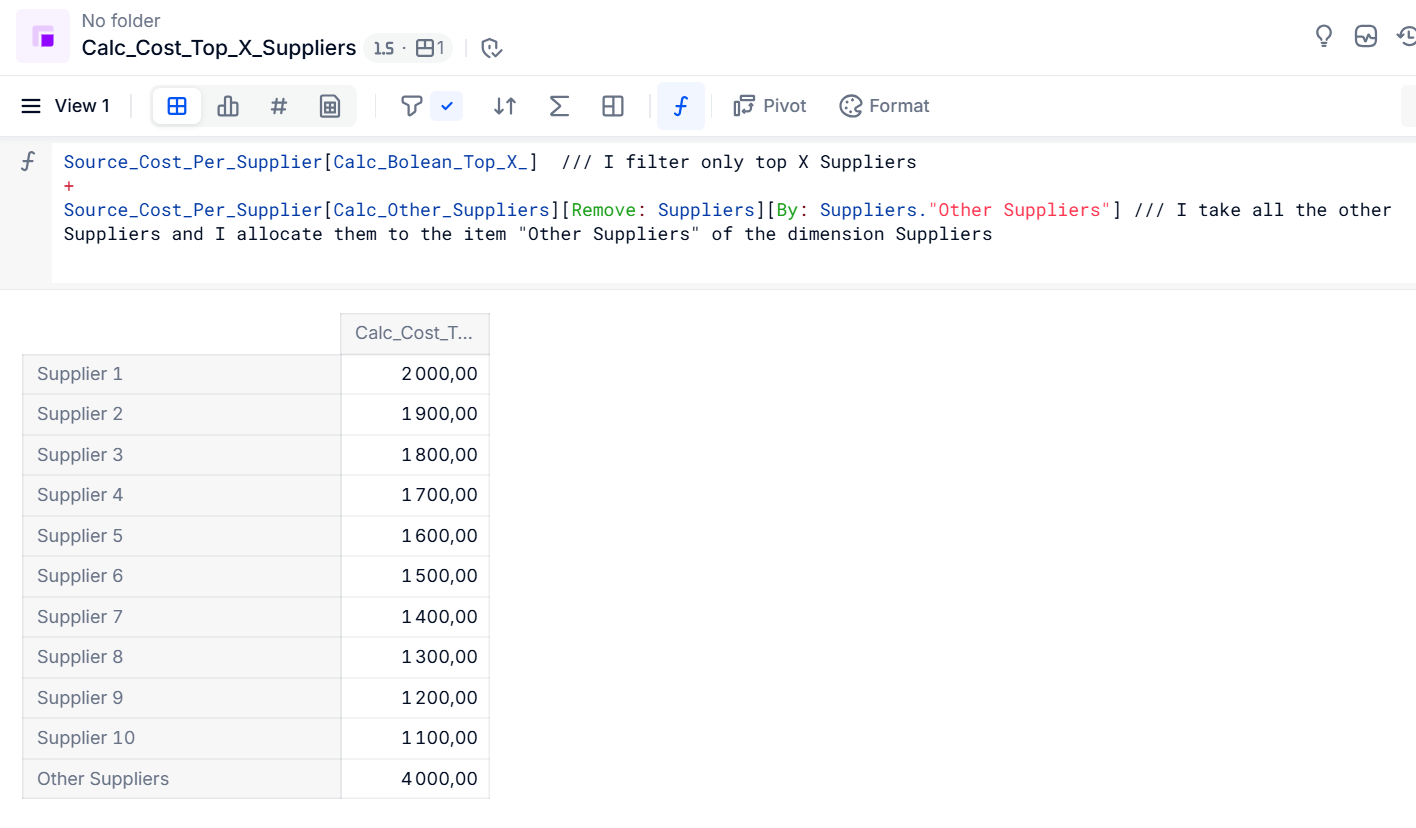
Do we have the ability to create a pie chart with only the top 10 of specific dimension values?

I wish to have this Chart live with the most updated Top 10 values.


Thank you,
Omer.

Hi Omer,

It’s a good idea that the product team is currently reviewing! You can upvote a similar idea here.

I also shared a workaround to make it using a metric if you need it right now.

If you build it in a grid, you can then turn it into a chart and it will keep the same items there.

Hope this helps you!


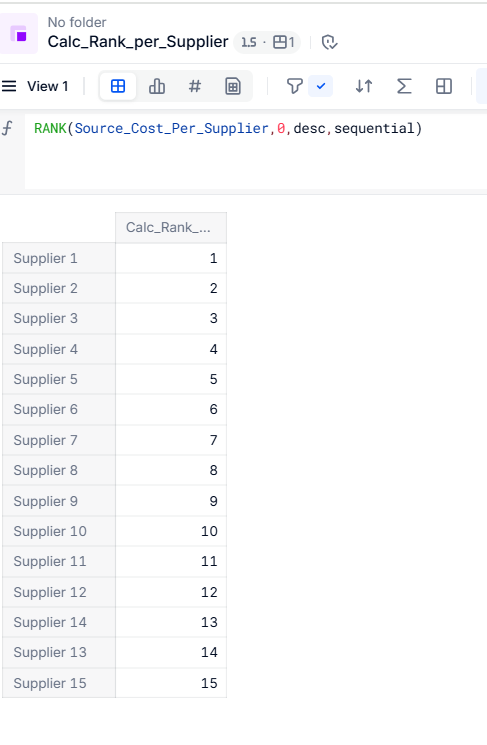
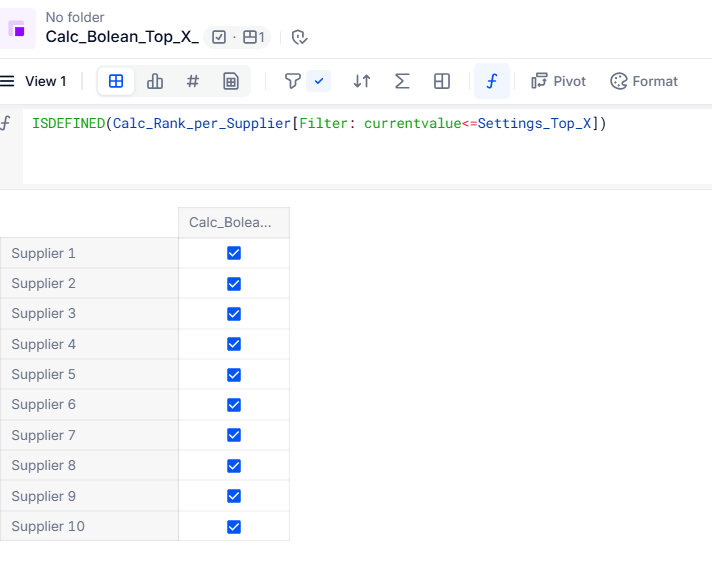
Solved with the new filter option :)
https://changelog.pigment.app/filter-to-identify-top-and-bottom-brackets-top-n-25qOwU


Is there a way to do this while then grouping the rest of the items into an “All Other” category? 

Example :


1.A

  1. B
  2. C
  3. All Other
  4. Total = A+B+C+All Other

Hi,

I believe you can do it this way:

Let’s assume you have a metric with a cost per supplier a a source.
 

Source: Cost per supplier

First, I would create a parameter metric that allows me to dynamically change the top X suppliers. It's 10 for the example,.
 

Settings: Top X suppliers


For this second step, I create a ranking by supplier using the Rank function.


Calculation: Rank per supplier

Then, I'll define all the suppliers that fall within the scope of the settings, the result of which is the top 10 as set in the previous metric.
 

Calculation: Bolean top X Suppliers

Same logic for Other Suppliers:
 

Calculation: Bolean Other Suppliers

Last step, I calculate the costs of the first 10 suppliers (first part of the formula).

I reallocate the remaining suppliers to an “Other Suppliers” element of the Supplier dimension in the second part of the formula.

Calculation: Final result

And there you have it, a dynamic way of ranking your top X suppliers😊

Let me know if you need further explanation,

Ahmed


Reply