


Hello! Could you help me with setting up the formula with the given metric/txn list below?
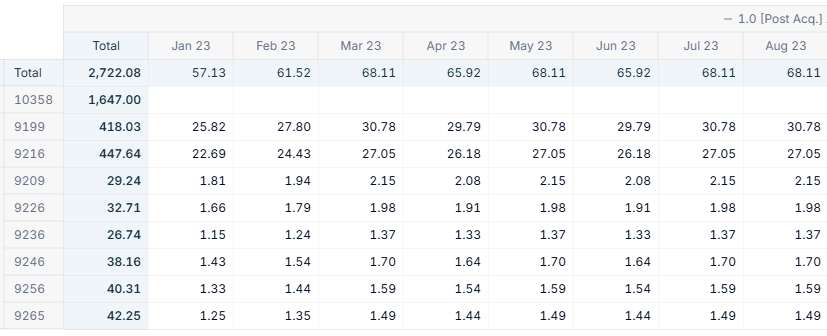
Metric: 1.0 [Post Acq.] Amortization Schedule (Forfeit+Current)
I created amortization metric for each grants by month. I confirmed this amort. distribution is correct.
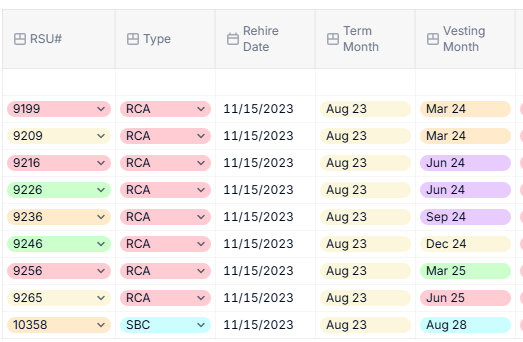
Transaction List: RSU Accounting Data
Below is the transaction list, providing the grant details for above metric (type, employee termed date, grant vesting month, employee original terminated month). Above metric is also based off this transaction list.
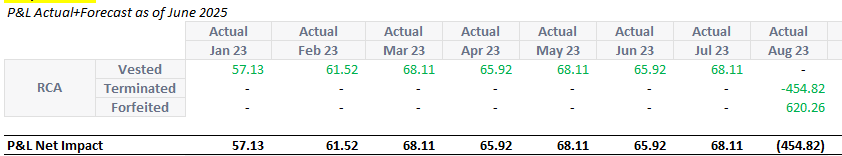
With given two blocks, I am trying to show the actual P&L impact for each month.
I’ve created the output table via excel below to show the result that i would like to see in metric.
Walkthrough:
-
RCA grants are scheduled to vest in 2024–2025 (per Grant/Vesting Date in the Data block), so monthly amortization was occurring prior to resignation, July 2023.
-
IF (Month < Term Month) AND (Month < Vesting Month) → Sum Amortization Schedule (1st table) by RSU# for each month.
-
-
Employee resigned in August 2023, after which all RCA grants — which were originally scheduled to vest post-resignation — were reversed in full (sum of the Jan-July).
-
IF (Month = Term Month) AND (Month < Vesting Month) → Sum Amortization (Jan–Jul) by RSU# * (-1)
-
-
Remaining RCA value (Aug 2023 and beyond) is forfeited, since vesting conditions are unmet after resignation. These amounts are not expensed to P&L but must be captured as forfeiture for full impact transparency.
-
IF (Month > Term Month) AND (Month < Vesting Month) → Sum Amortization (from Term Month onward) by RSU#
-
-
As a result, RCA shows:
-
A net zero impact as of August 2023.
-
A cumulative net impact of $454.82 as of July 2023.
-
A forfeited value of $620.26, representing the reversal of future amortizations since the grants became ineligible post-resignation.
-
What’s the best way/formula to create this result?

