Hi all - I was trying to do something similar to the analysis Actuals vs Forecast as it is shown in the video of this use case.
In that example, Actuals and Forecast columns are version dimension, right?
How is it possible to do the monthly variance and the YTD variance all in the same table? I did something simliar but in two different tables because in one I need only one month and in the YTD I need several so it’s a different filter
How can I link the variance reason to the actual delta (maybe it should be something around the by→ but not sure).
Does anyone have experience on doing so? I’m struggling a bit.
Thanks!
Best answer by Min Li
In that example, Actuals and Forecast columns are version dimension, right?
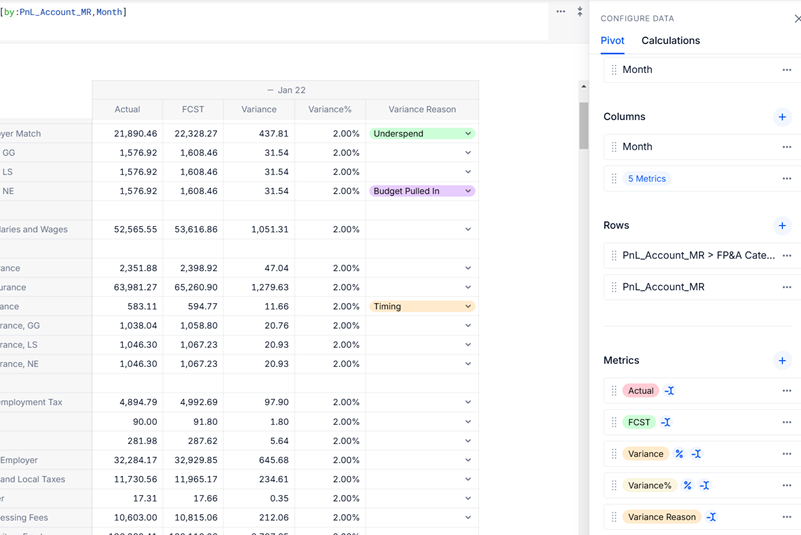
In my example, I created two metrics for actual and forecast respectively using the same account dimension. Then I calculated variance and variance% by adding the metric again and show value as.
Steps are shown below:
Step 1: Create two metrics for Actual and Forecast using some Account dimension.
Step 2: Added the metrics to the table
Step 3: Click the 3 dots after metric FCST and select Add this Metric again
Step 4: Click the 3 dots after newly added metric FCST and select Show Values As
Step 5: For calculating Variance, select Difference of a Metric and under metric lists, select Actual
Step 6: Repeat step 3 and 4, then select % growth from a metric for calculating Variance%
How is it possible to do the monthly variance and the YTD variance all in the same table? I did something simliar but in two different tables because in one I need only one month and in the YTD I need several so it’s a different filter
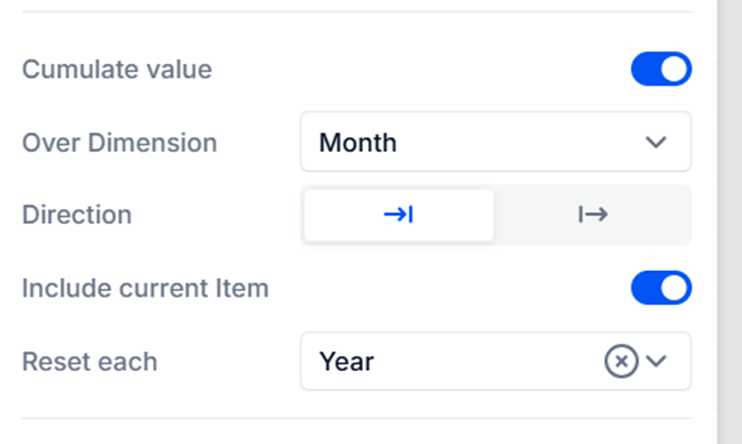
Under the configure calculated item panel, you can set up YTD calculation as below.
How can I link the variance reason to the actual delta (maybe it should be something around the by→ but not sure).
In order to add variance reason to the table,
1 Created a dimension table with all the reasons
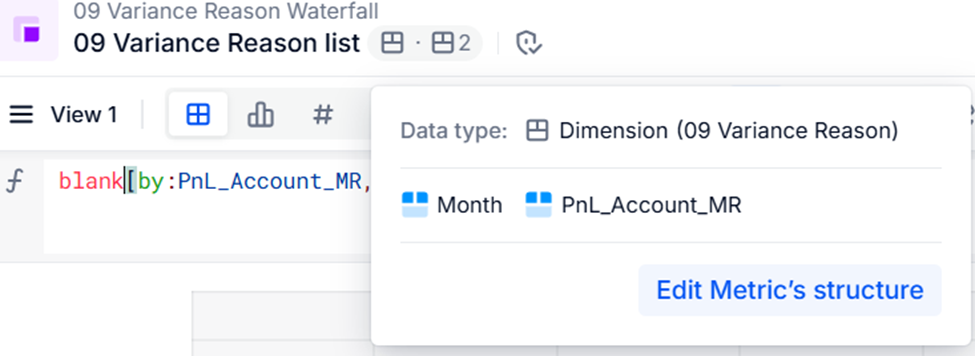
2 Created a metric with Data Type dimension (referencing to the reason dimension table) including account and month dimension in this metric
3 Under setting panel, toggle on Allow overriding formula results with an input
In that example, Actuals and Forecast columns are version dimension, right?
In my example, I created two metrics for actual and forecast respectively using the same account dimension. Then I calculated variance and variance% by adding the metric again and show value as.
Steps are shown below:
Step 1: Create two metrics for Actual and Forecast using some Account dimension.
Step 2: Added the metrics to the table
Step 3: Click the 3 dots after metric FCST and select Add this Metric again
Step 4: Click the 3 dots after newly added metric FCST and select Show Values As
Step 5: For calculating Variance, select Difference of a Metric and under metric lists, select Actual
Step 6: Repeat step 3 and 4, then select % growth from a metric for calculating Variance%
How is it possible to do the monthly variance and the YTD variance all in the same table? I did something simliar but in two different tables because in one I need only one month and in the YTD I need several so it’s a different filter
Under the configure calculated item panel, you can set up YTD calculation as below.
How can I link the variance reason to the actual delta (maybe it should be something around the by→ but not sure).
In order to add variance reason to the table,
1 Created a dimension table with all the reasons
2 Created a metric with Data Type dimension (referencing to the reason dimension table) including account and month dimension in this metric
3 Under setting panel, toggle on Allow overriding formula results with an input
I am newer to Pigment and have figured out how to build this table. However, I lack experience building waterfall charts. Can someone outline the steps I should follow to build the chart and which metrics should be in the columns and rows? I am having difficulty getting “variance reason” onto the chart.
I have “actuals”, “budget”, and “variance” metrics as well as a “variance reason” dimension that are all on the table.