Variance Table Across Year and Version Dimensions – Seeking Advice
Hi everyone,
I’ve come across a need to compare the current year’s forecast against next year’s live forecast, and noticed that this requires referencing two dimensions: Year and Version, or Year and Scenario.
For example, I’m trying to build a variance table for a set of metrics where the variance is calculated as: (2025 Year + 2025 Forecast Snapshot) – (2026 Year + 2026 Live Forecast).
Has anyone built something similar—where you can select different years and different versions (or scenarios) and calculate the variance between them?
Thanks in advance!
Page 1 / 1
Hi Neo,
I came across this helpful guide that explains how to set up variables and page selectors for dynamic comparisons with Version Variances
Let me know if this works for your need I think you can extend this example with Years as well.
Thanks JDLove - I’ll give it a try and let you know if that works for me ;)
Ah, it seems the recommendation only supports filtering by one dimension at a time. What I need, however, is the ability to compare two sets of values across two different dimensions:
Set 1: Year = 2026, Version = Live Forecast
Set 2: Year = 2025, Version = Forecast May 25 Snapshot (or possibly Actual)
Would you happen to have any other suggestions that might allow for this type of comparison? I’m not sure the ‘Add a calculated item’ option would work here, since it doesn’t seem to support referencing different values from two separate dimensions within the same item.
Hi Neo,
Have you thought of manipulating your source metric, so the particular year X version combinations are loaded onto a single fixed dimension item? This way your values will sit on the same dimension item and could be used for calculated items.
For example,
2026 x Live Forecast → load to 2026 x Technical dimension item in version (might need to create this techincal item in the version table, or use/repurpose an existing one)
2025 x Forecast May 25 → load to 2025 x Technical dimension item in version
Hi Again,
Yes it seems you are correct, the calculated item is only based on the dimension, in you case this is not sufficient to allow you to compare across 2 dimensions (Year, Version)
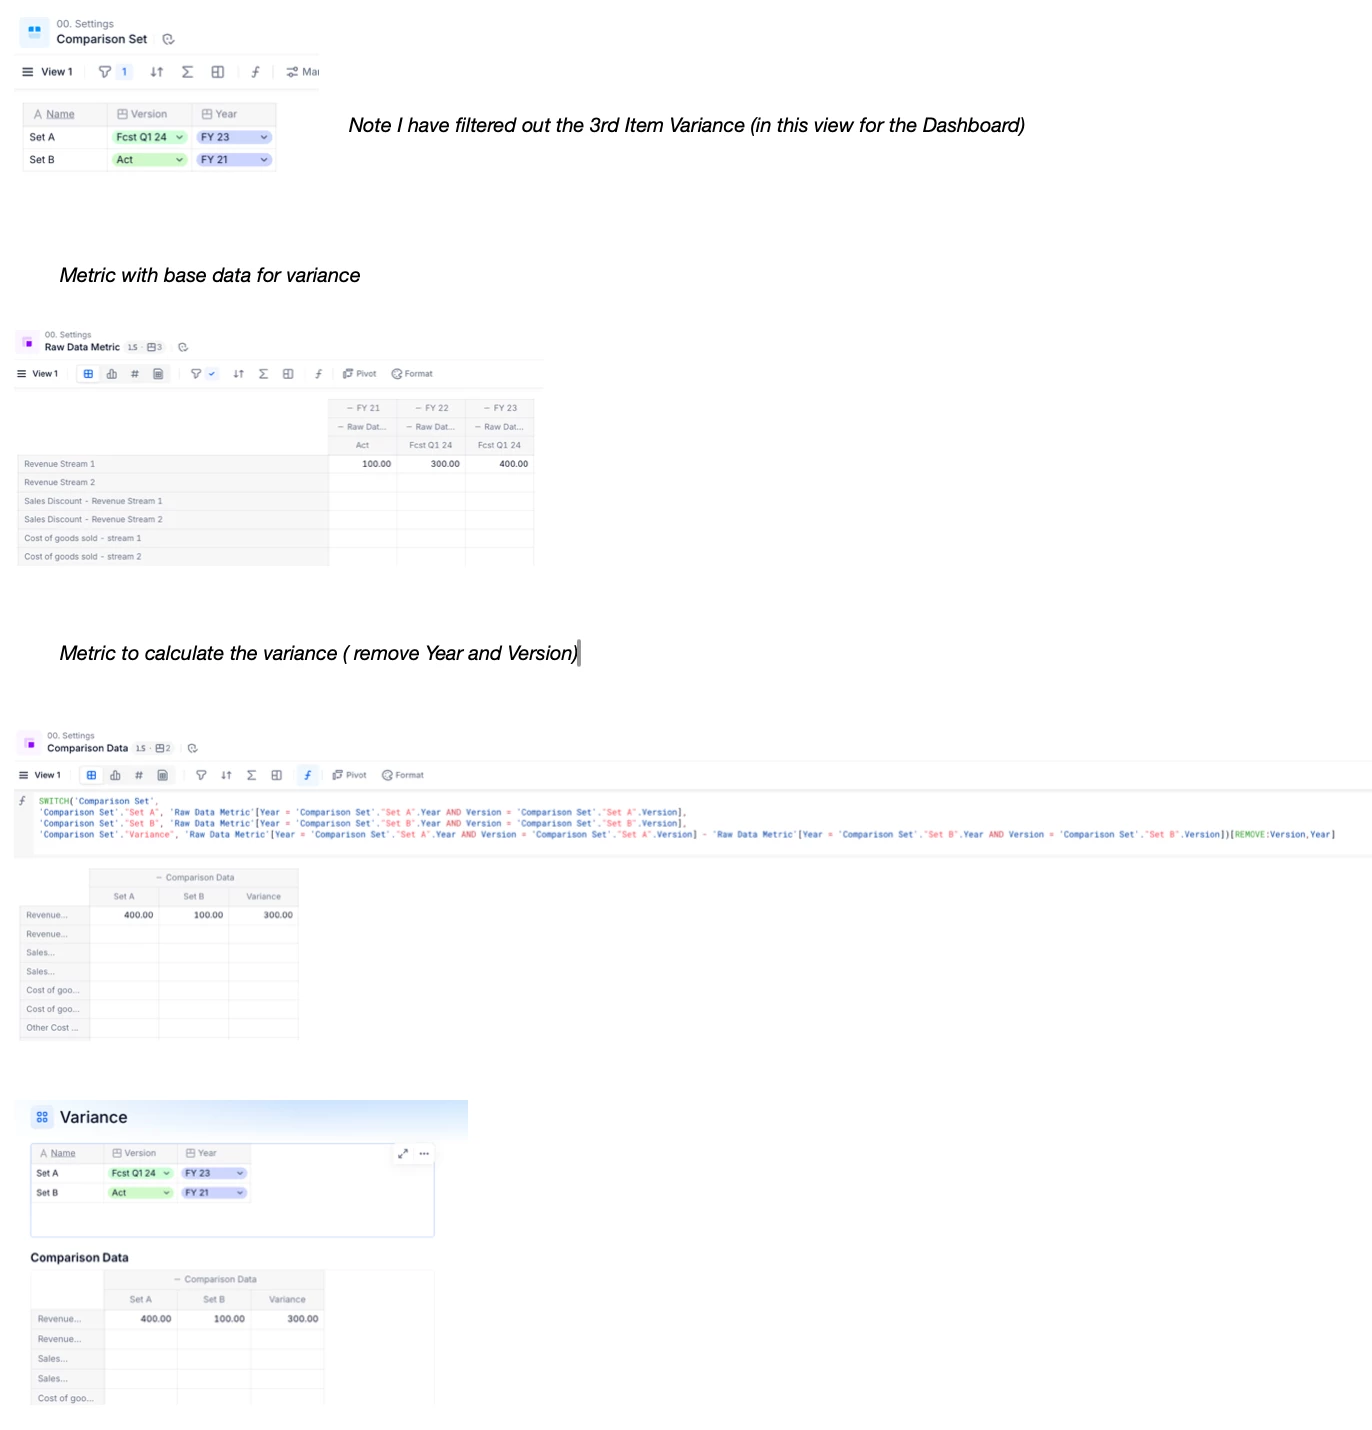
I think I would start looking at creating a new metric to calculate this variance.
Use Dimension List to hold the Variance Set (Year, Version)
Use a new Metric without the dimensions (Year, Version) and use the same Dimension above to hold the variance.
Basic mockup below of my thoughts, hope this gets either better replies or gets you started on some options.
SWITCH('Comparison Set', 'Comparison Set'."Set A", 'Raw Data Metric'aYear = 'Comparison Set'."Set A".Year AND Version = 'Comparison Set'."Set A".Version], 'Comparison Set'."Set B", 'Raw Data Metric'aYear = 'Comparison Set'."Set B".Year AND Version = 'Comparison Set'."Set B".Version], 'Comparison Set'."Variance", 'Raw Data Metric'aYear = 'Comparison Set'."Set A".Year AND Version = 'Comparison Set'."Set A".Version] - 'Raw Data Metric'aYear = 'Comparison Set'."Set B".Year AND Version = 'Comparison Set'."Set B".Version])VREMOVE:Version,Year]
Hello both !
We are currently working on a new feature that will help solving this problem! This should come during Q3, so keep your eyes opened
This feature will allow you to combine several dimensions together and select the intersections that make sense. With this, you will only have one dimension present in your view, which will both allow you to create calculated items on those intersections, but also to filter down the view to only the relevant intersections of those dimensions.
Hey Carole,
That will be super useful! I have this requirement from time to time as well, and right now the workaround is to manipulate the source metric and reduce the number of comparable dimensions to one by placing the necessary values from the second dimension to a single technical dimension item. Or alternatively, as JDLove suggested, create reporting sets, though I find them less flexible, unintuitive and their performance also tends to be poorer. Can’t wait to see this feature roll out!
Cheers!
@Carole Nice to hear of this feature, the power to get these variances all in the core grid options is impressive !
@Laszlo I am interested in your approach, would you be able to create a quick mockup and post here for completeness and an interim solution. For me I was unable to follow your meaning and design in the 2 above replies, others may need an interim solution and having options helps us all. Thanks in Advance


 I have this requirement from time to time as well, and right now the workaround is to manipulate the source metric and reduce the number of comparable dimensions to one by placing the necessary values from the second dimension to a single technical dimension item. Or alternatively, as JDLove suggested, create reporting sets, though I find them less flexible, unintuitive and their performance also tends to be poorer. Can’t wait to see this feature roll out!