I’m trying to compare two scenarios in a waterfall chart so I can see which was the total revenue expected in Scenario 1 vs which is the new expectation in Scenario 2 while seeing the main drivers of this change.
I’m trying to compare scenarios in a table and then convert it into a graph but it is not working.
How can I do it?
Thanks!
Best answer by Andrea
Hello Guillermo!
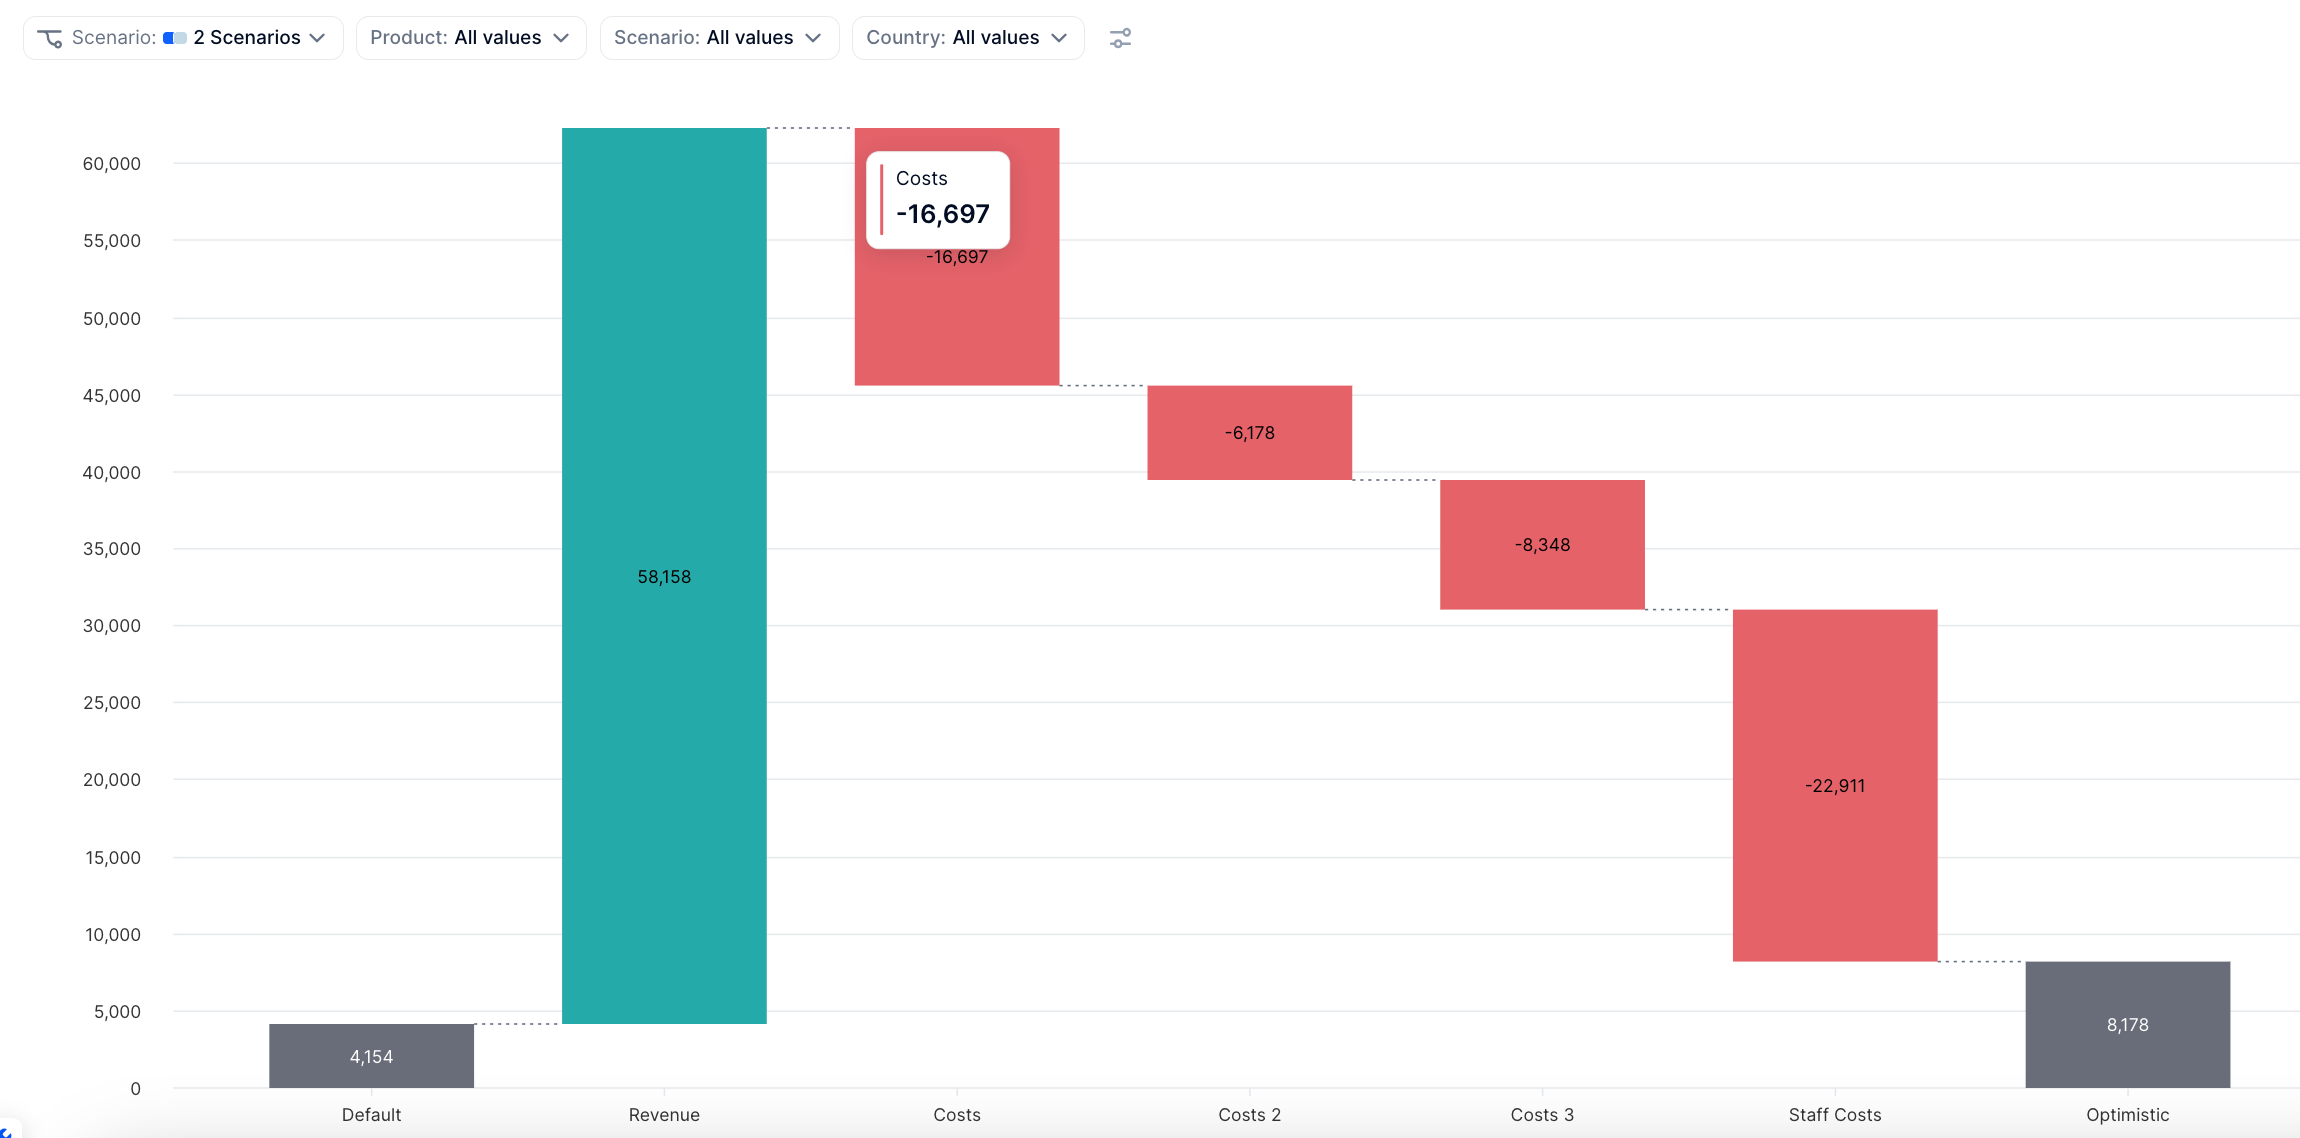
Scenarios are compatible with Waterfall Charts on Tables. The “drivers” need to be modelled by yourself with metrics. Regarding the configuration, you need Scenarios in Columns and Metrics in Rows and you need to set the Revenue Metric (the one that you want to analyse) as the reference Step in the Waterfall configuration. See the attached table and its corresponding Waterfall Charts.
Scenarios are compatible with Waterfall Charts on Tables. The “drivers” need to be modelled by yourself with metrics. Regarding the configuration, you need Scenarios in Columns and Metrics in Rows and you need to set the Revenue Metric (the one that you want to analyse) as the reference Step in the Waterfall configuration. See the attached table and its corresponding Waterfall Charts.