When working in Tables and Metrics, you can filter your Views for use in Boards or Charts. Here we tell you all about using filters in Pigment.
How to Filter in Pigment
From within either a Metric or Table, click the Filter icon and click + Add a Filter. When you’re done creating filters, the number of applied filters is visible next to this icon.
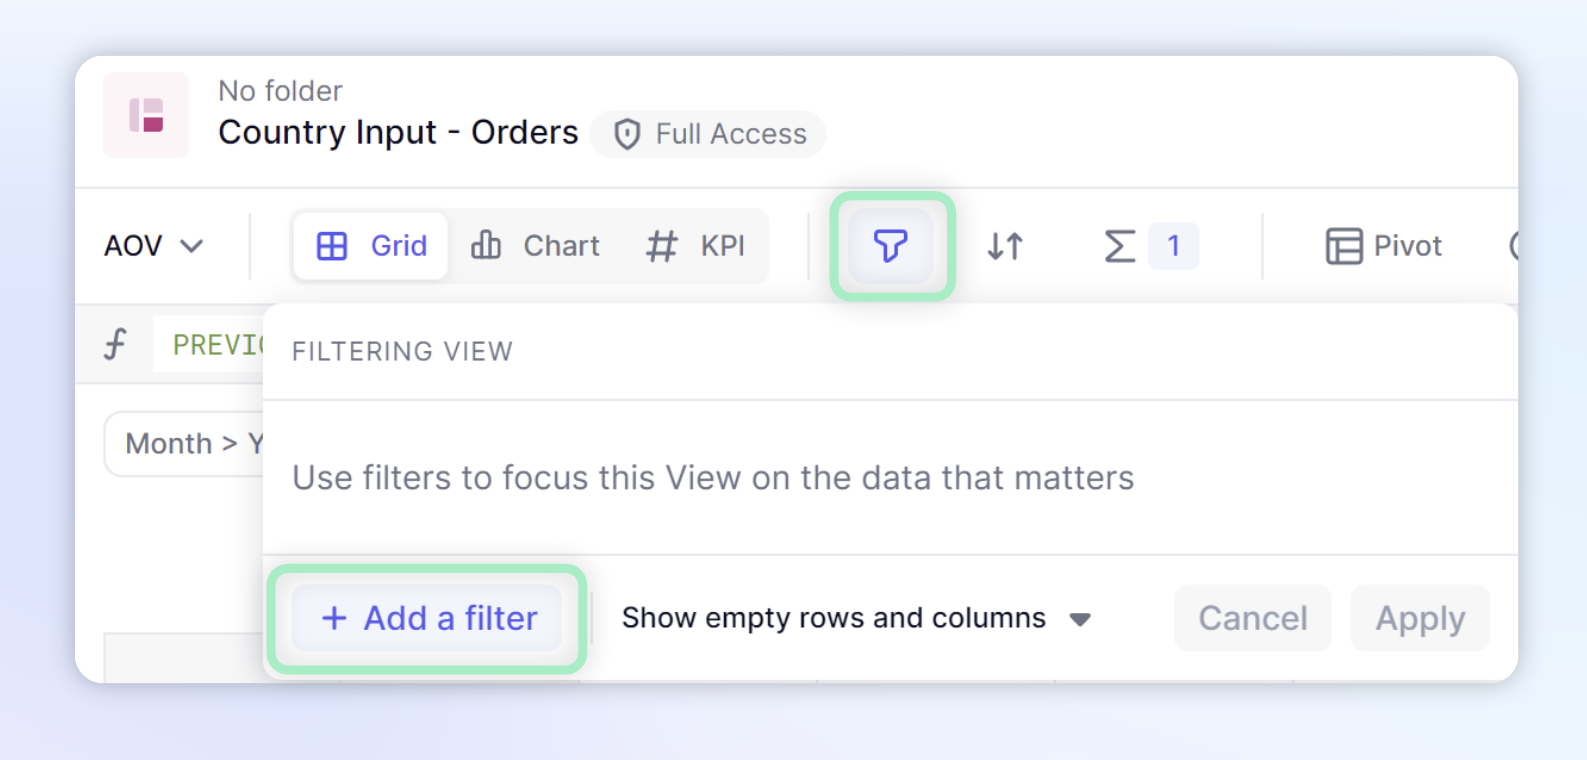
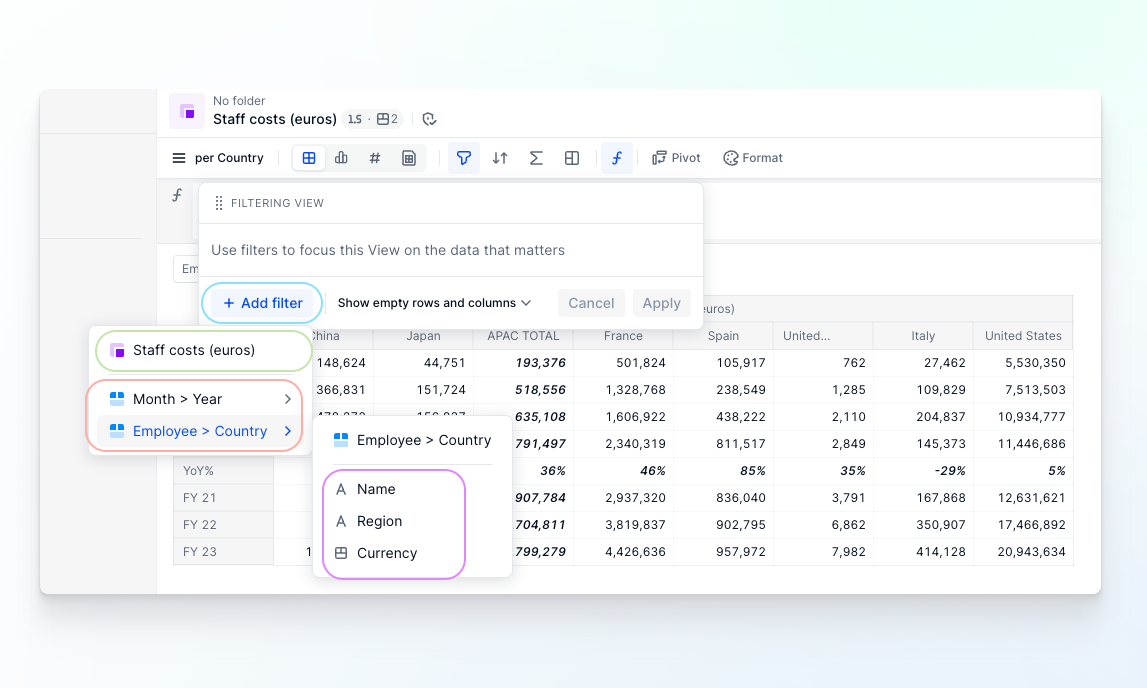
When you click + Add a filter, you have the option to:
- Select a Metric, and then filter the underlying Dimensions by the Metric value
- Select a specific Dimension and directly filter its items or filter its items based on one of its Properties
Filter by Metric
When you select a Metric from the Add a filter menu, this filters Items belonging to the most granular underlying Dimension in the View, depending on the cell values for that Metric.
The options for filtering by Metric depend on your Pivot configuration:
- the filtered Dimensions are automatically inferred from the grid configuration
- filters are applied to the most granular Dimensions that are closest to the View
You can also right-click a specific grid header to create a filter that’s based on a Metric. Each new filter you add using this method creates a separate rule in the filter panel.
If you use this shortcut in Tree mode in Views, filtering is applied to the closest Dimension to the grid. For this reason, we recommend that you expand the Tree mode before filtering. When multiple Metrics are available for filtering on Tables, you need to choose just one Metric.
Filter Dimension-type Metrics with Variables
In Pigment, when filtering Dimension-type Metric data, you can use a Variable to filter between that Dimension’s Items. This is particularly useful if you want to allow Members to filter these Items directly from the Board. You can also filter by Dimension Property, where the Property is of type Dimension.
To apply this type of filter, do the following:
- Create a Variable on the required Dimension on your Metric. See guidance here.
- (Optional) If you want users to dynamically choose which Items should be filtered, then enable the option that allows Members to change Variable values in their session. When you enable this option, the Dimension Item values are displayed in a separate menu next to the Page Selector wherever your Metric is used.
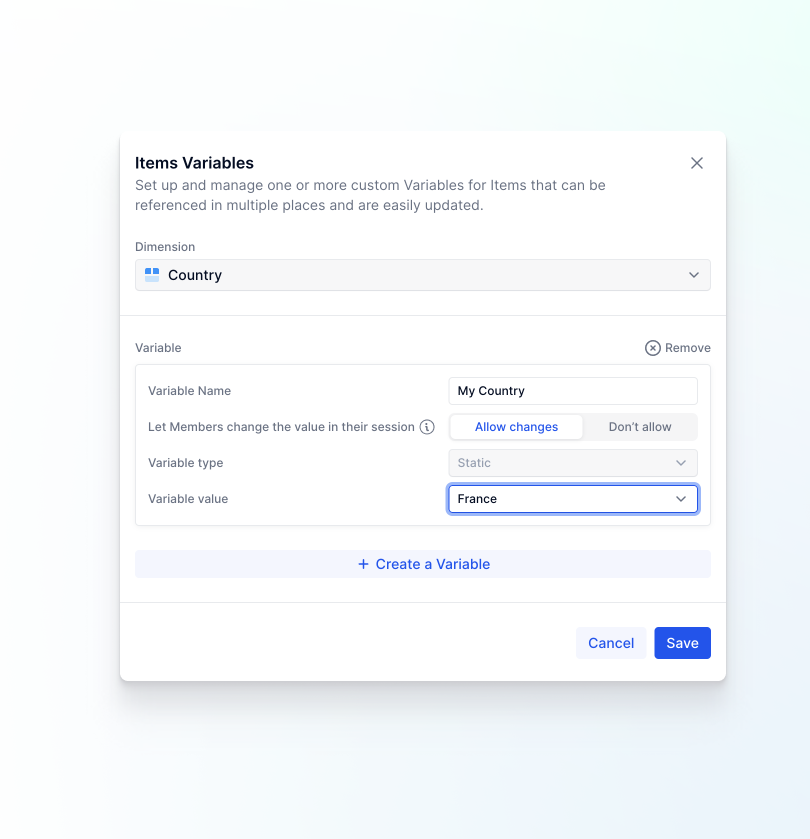
-
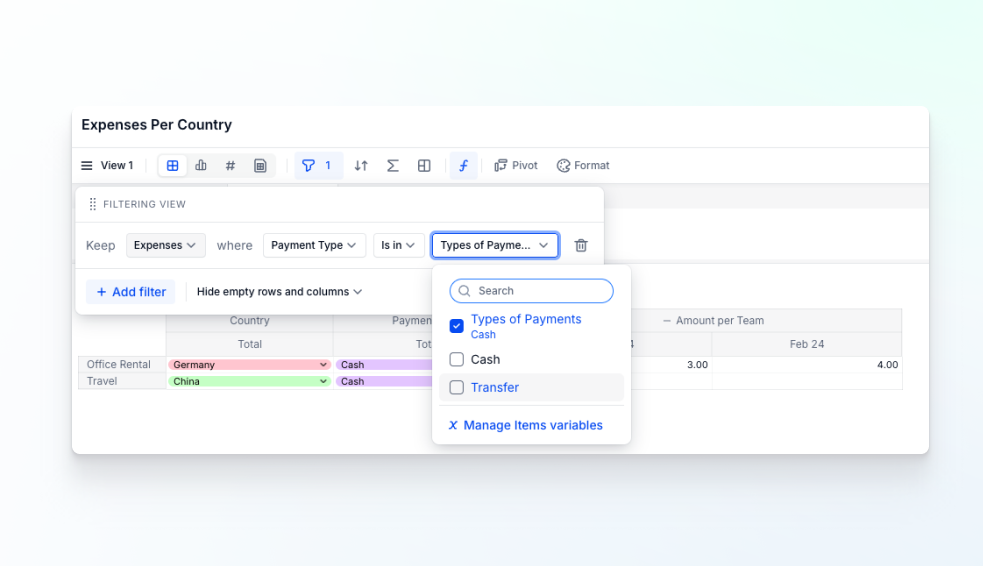
In your Metric, open the Filter panel and create a new filter.
-
Select the new Variable from the menu, and click Apply.
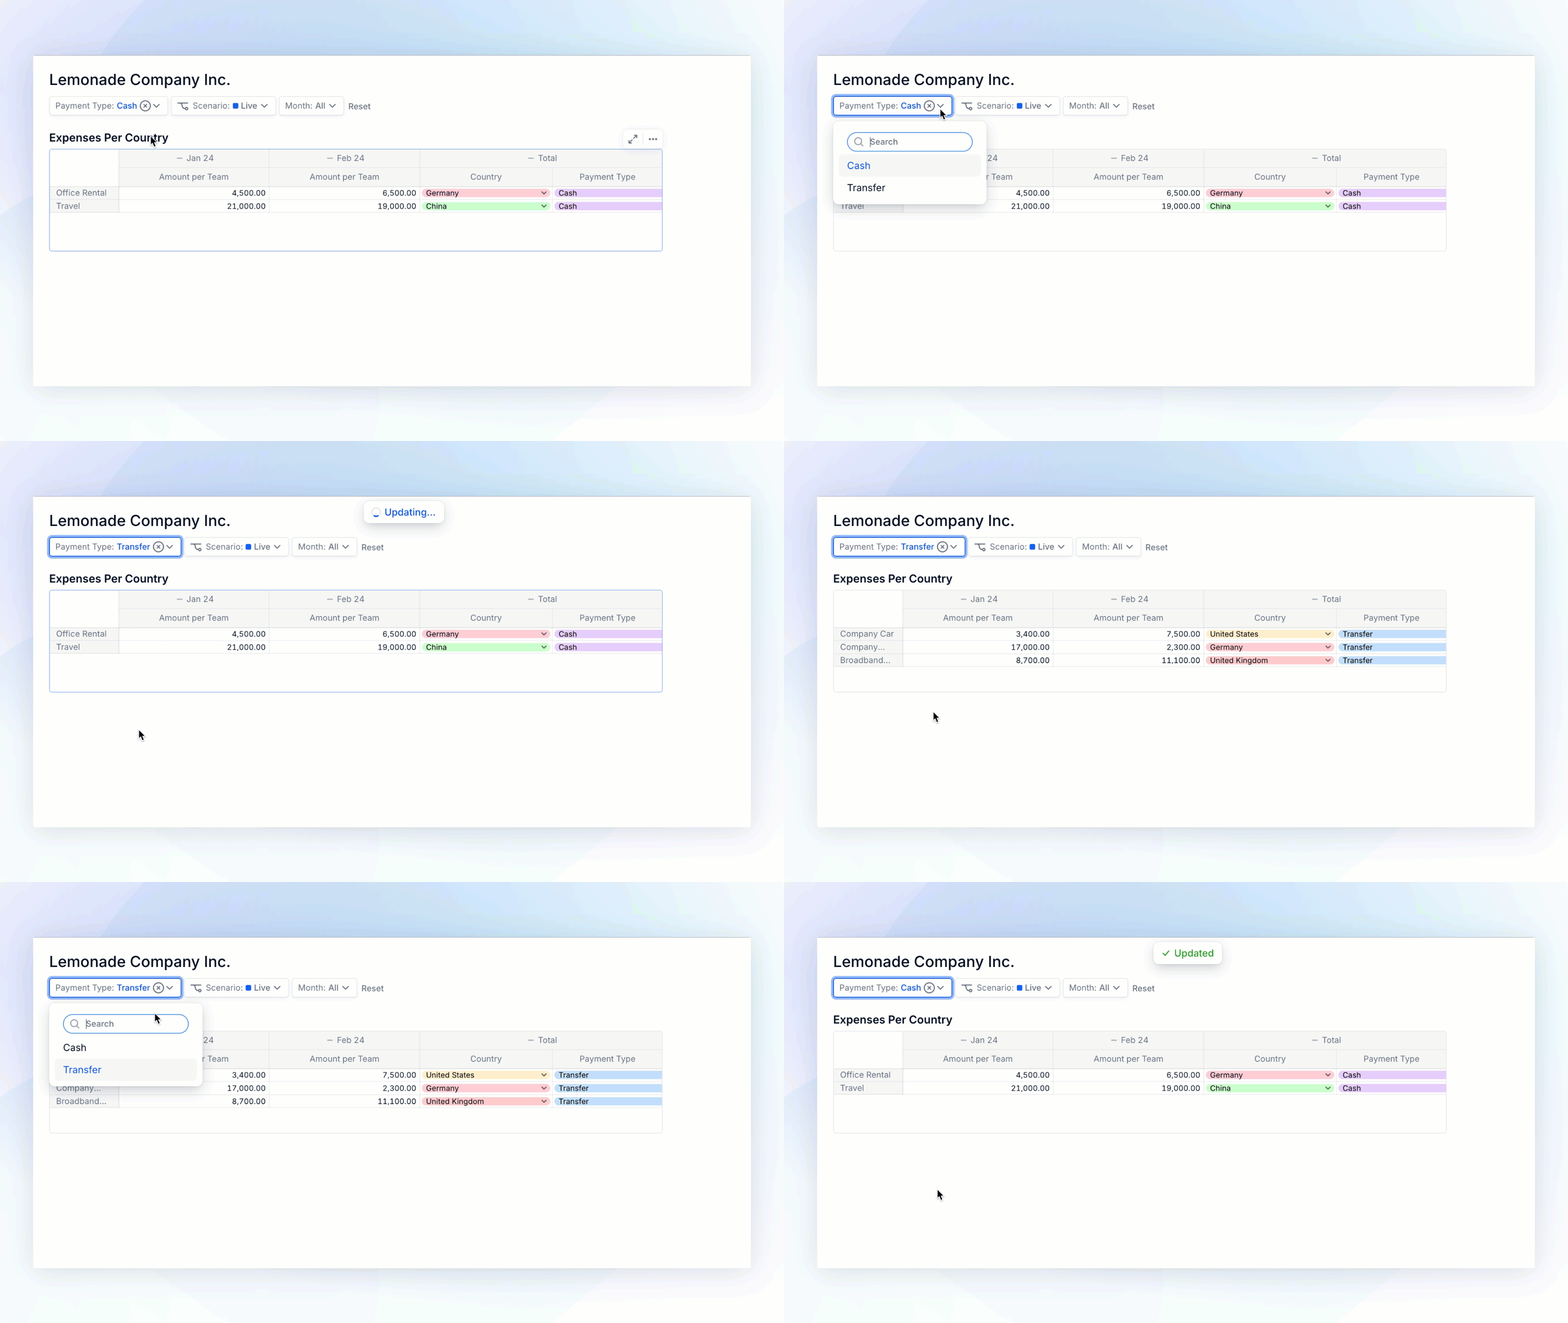
The Dimension Items on which you can filter are available as a selector beside the Page Selectors. This selector's options can be customized almost in the same way as any Page Selector option. For more information, see Use Page Selectors to Customize Context in Views and Boards.
Filter by Dimension
When you select a Dimension from the Add a filter menu, you can apply a filter based on that Dimension’s Items. Only Dimensions in Rows or Columns can be filtered. After you choose the Dimension you want to filter, you can filter by directly selecting the items.
- If you select is in, it only shows those items.
For example, if a filter is set to Filter Product where Items is in Product A, then the result is that only Product A is shown.
- If you select is not in, it only removes those items.
For example, if a filter is set to Filter Product where Items is not in Product A, then the result is that only Product A is the only item not present. When choosing these options it's important to think of the future of the list. If you use the Exclude option, all new items will be shown.
Filter by Dimension Property
When you select a Dimension Property from the Add a filter menu, you can filter a Dimension based on values stored within that Dimension’s Properties. Depending on the Property data type, you will get different options on the type of rule you can set it.
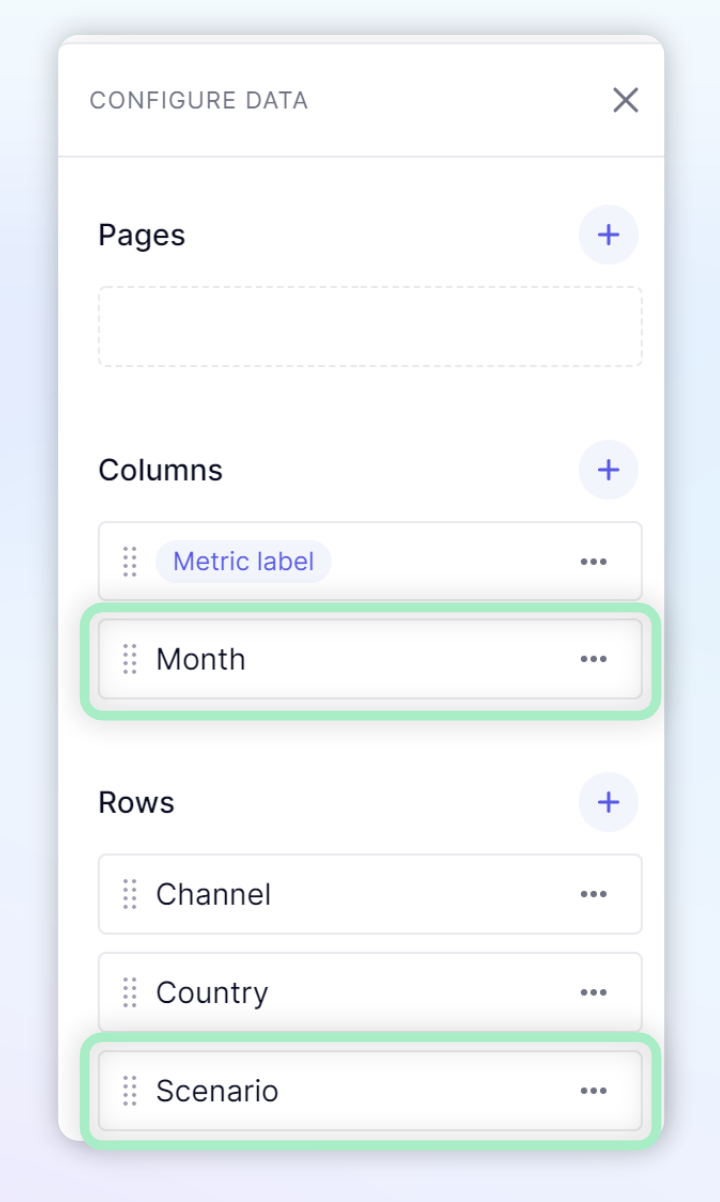
Eligible Dimensions for Filtering
In this example, you can select the Metric value for the Month or the Scenario Dimension. These are considered the most granular Dimensions within a View.
Use Operators in Filters
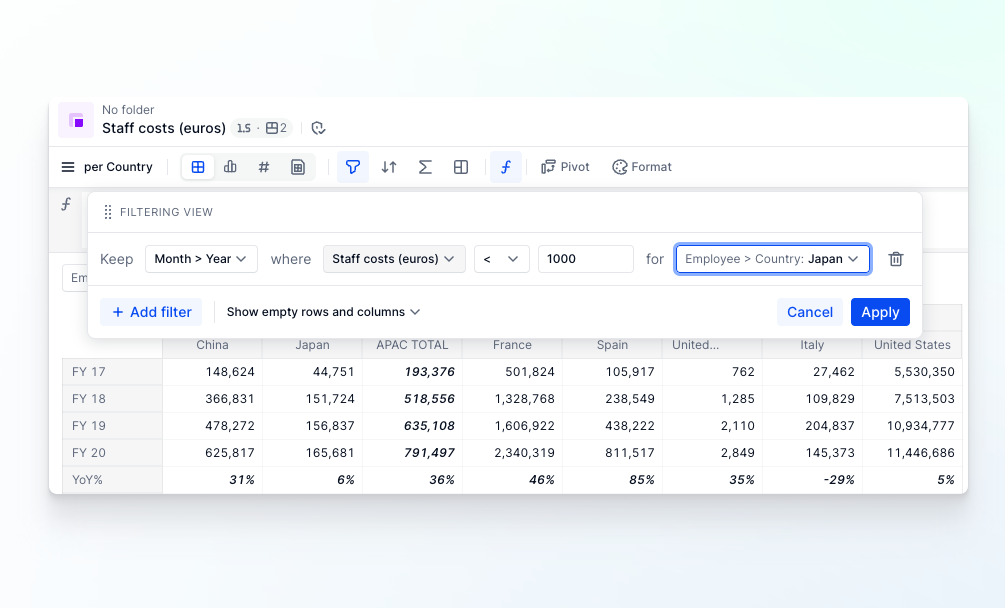
After you choose which Dimension you want to filter, you need to choose an operator such as equals (=), less than (<) or greater than (>), and then you need to enter a value on which to base those operators. These are dependent on the Item type. For example, operators such as Contains exist for Metrics that are Text data types.
Understand Rules in Filters
When adding multiple rules to a filter, you must set how the rules interact with each other, the options are OR and AND. The AND operator means that all conditions must be met for the rule to be true. For example, if you have two rules:
- Rule A: The sky is blue
- Rule B: It is daytime
An AND combination would only be true if both Rule A and Rule B are true - that is, if the sky is blue and it is daytime.
On the other hand, the OR operator means that only one of the conditions needs to be met for the rule to be true. Using the same rules as before, an OR combination would be true if:
- Rule A is true (the sky is blue)
- Rule B is true (it is daytime)
- Both are true
In summary, AND requires all conditions to be satisfied, while OR requires at least one condition to be satisfied. When setting up multiple rules, you can only use one of these options for the entire filter. This means all rules will be set to the condition of OR or AND.
Combine Filtering and Sorting to see Top and Bottom Brackets
You can filter items by Metric values such as Integer, number, or dates. Choose to filter items in either the top or bottom categories by specifying the size of the category and whether it should include the highest or lowest values.
When filtering with Metric values that are integers, numbers, or dates, you can choose to filter items in either the highest or lowest value brackets. You can do this by defining the size of the value bracket, and if it should be in the highest or lowest values.
- Select the Metric value.
- Use the operators menu to select either
is in the toporis in the bottom. - Enter a number to define the size of the bracket. For example, if you wanted to see your top 5, you select
is in the topand then enter 5.
When the filter is activated, it also activates the Sort functionality. The Sort’s location is determined by the choice of either Top or Bottom. This filtering option ignores blank values.
Identify Item Specifics from Opposite Dimensions
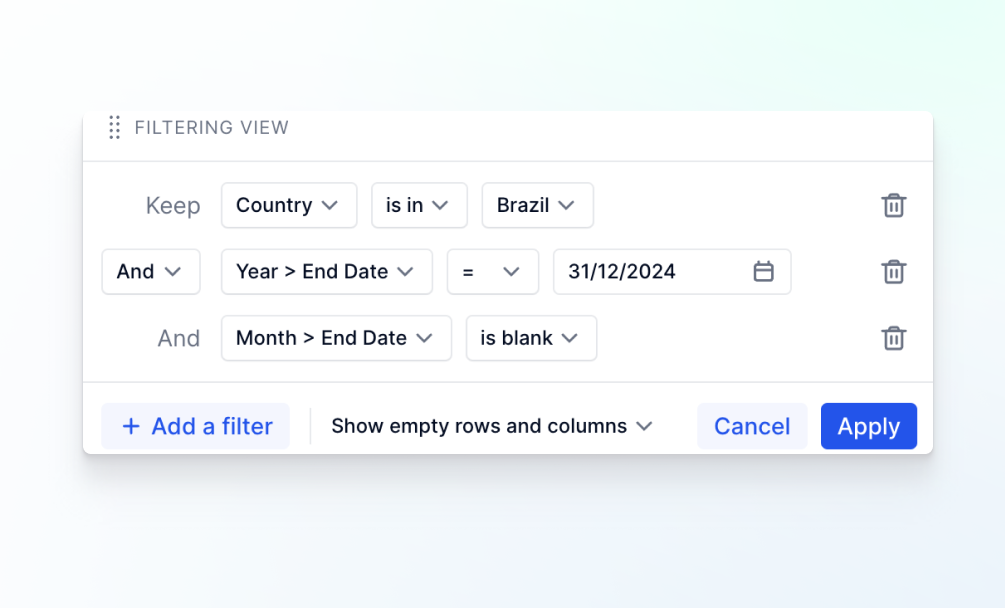
When using a Metric value, you must identify the specific Items from the Dimensions opposite to the filtered Dimension. This means if your filtered Dimension is in Rows, you have to show the specifics for the Dimensions in the Columns and vice versa. The position of these is determined by the Pivot panel.
In this example, the Country Dimension is in Rows, the Year and Month Dimensions are in Columns. If you want to filter multiple items from opposite Dimensions, you can create multiple filters.
Hide Empty Rows or Columns
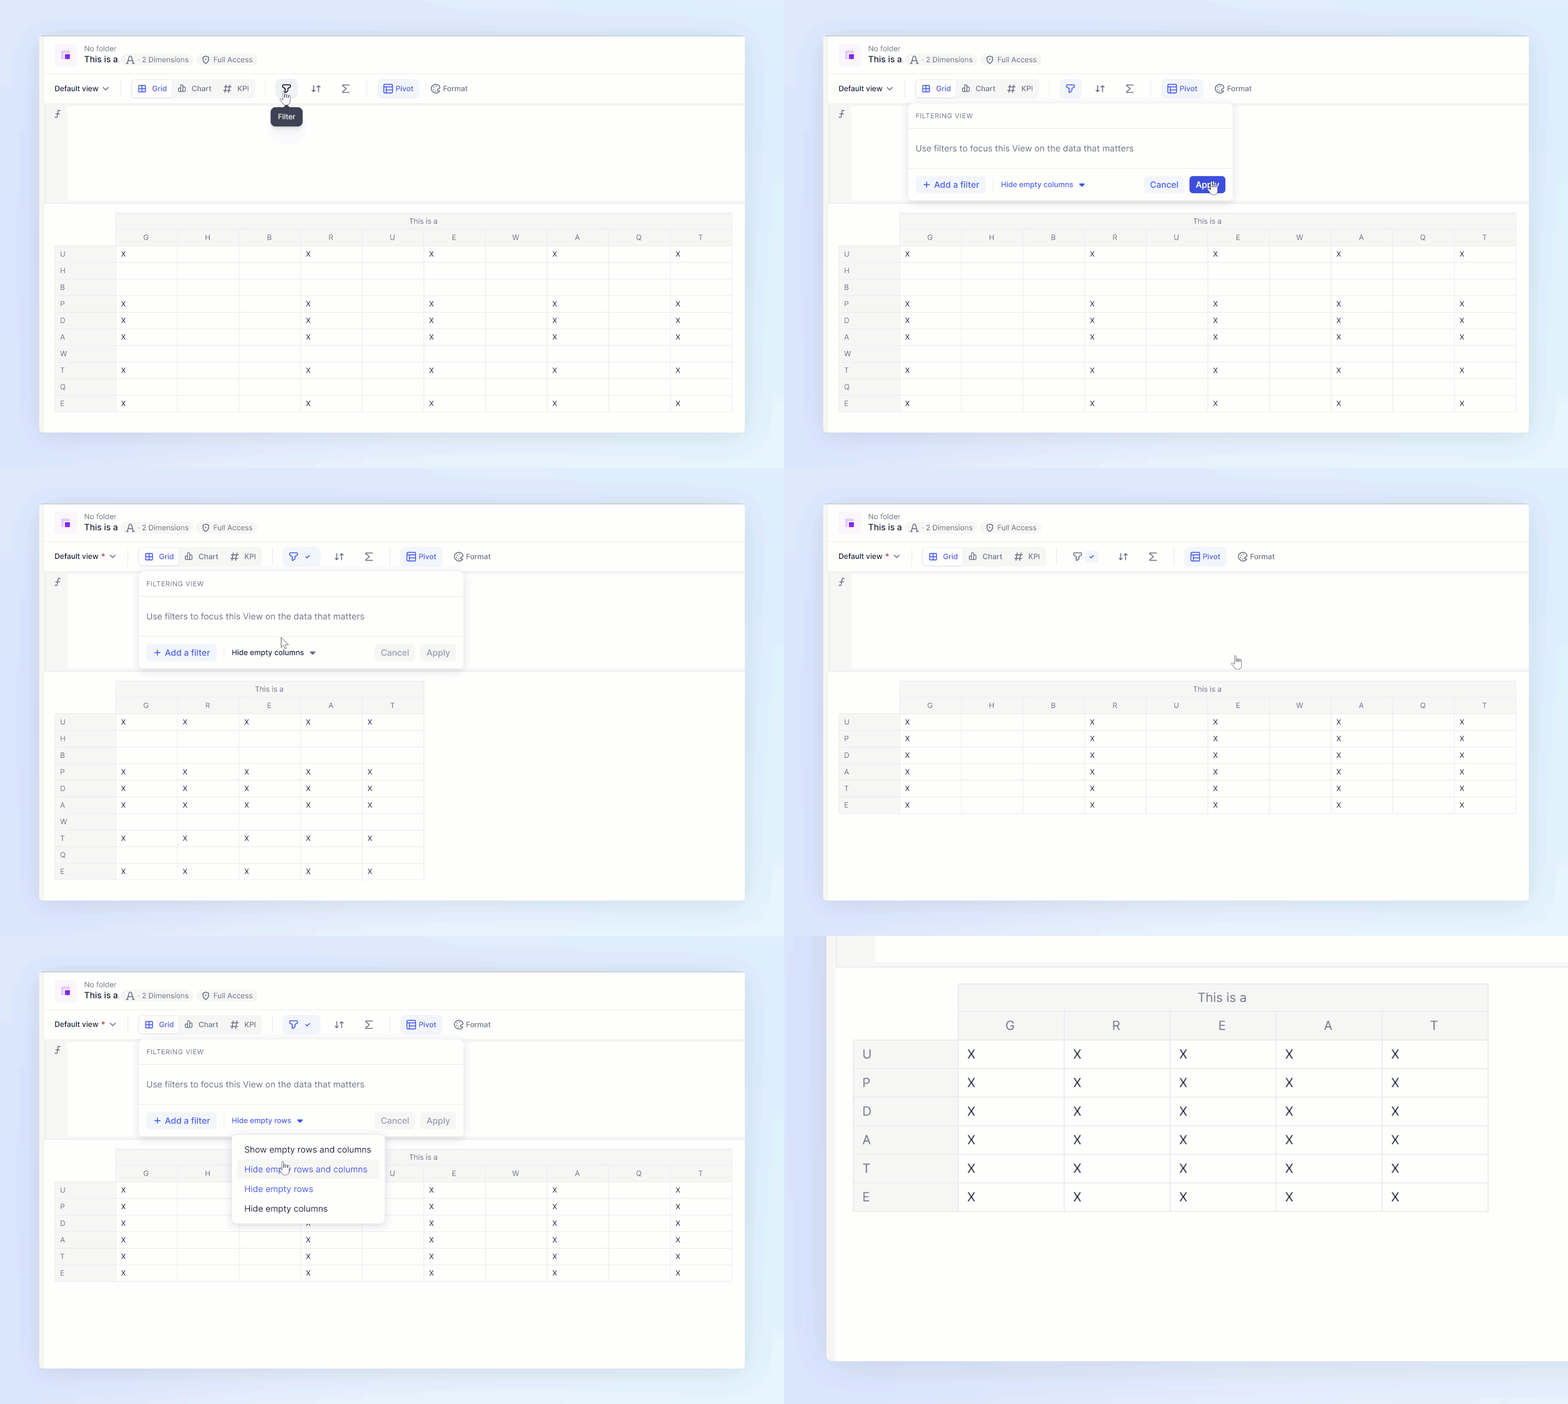
When working with Metrics or Tables, you can hide empty columns or rows if they have no data. From within the filter, click Show empty rows and columns to see multiple options. You can hide empty rows or columns, either separately or together, to make your data easier to find.
