
With mapped Dimensions, you can dynamically group data within a View, without having to redesign your model.
This feature provides an alternative to changing the Dimension structure of each Metric in a Table, making Tables faster to build and more performant.
Before you begin
You can use a Property to group data when there is a static relationship between two Dimensions. For example, grouping Countries into Regions through a Property is appropriate because a Country typically remains in the same Region. For more information, see Set up Properties in Lists.
However, when relationships are dynamic, such as employees belonging to teams that change from month to month, a different approach is required. In these cases, use mapped Dimensions.
 Important
You need certain Permissions depending on what mapped Dimensions actions you wish to carry out:
- To add a mapped Dimension to a View using the Pivot panel, you need the Configure Views permission.
- To set up a mapping Metric, you need the Configure Blocks permission. See Make a mapping Metric for more information.
Use cases
In a Metric
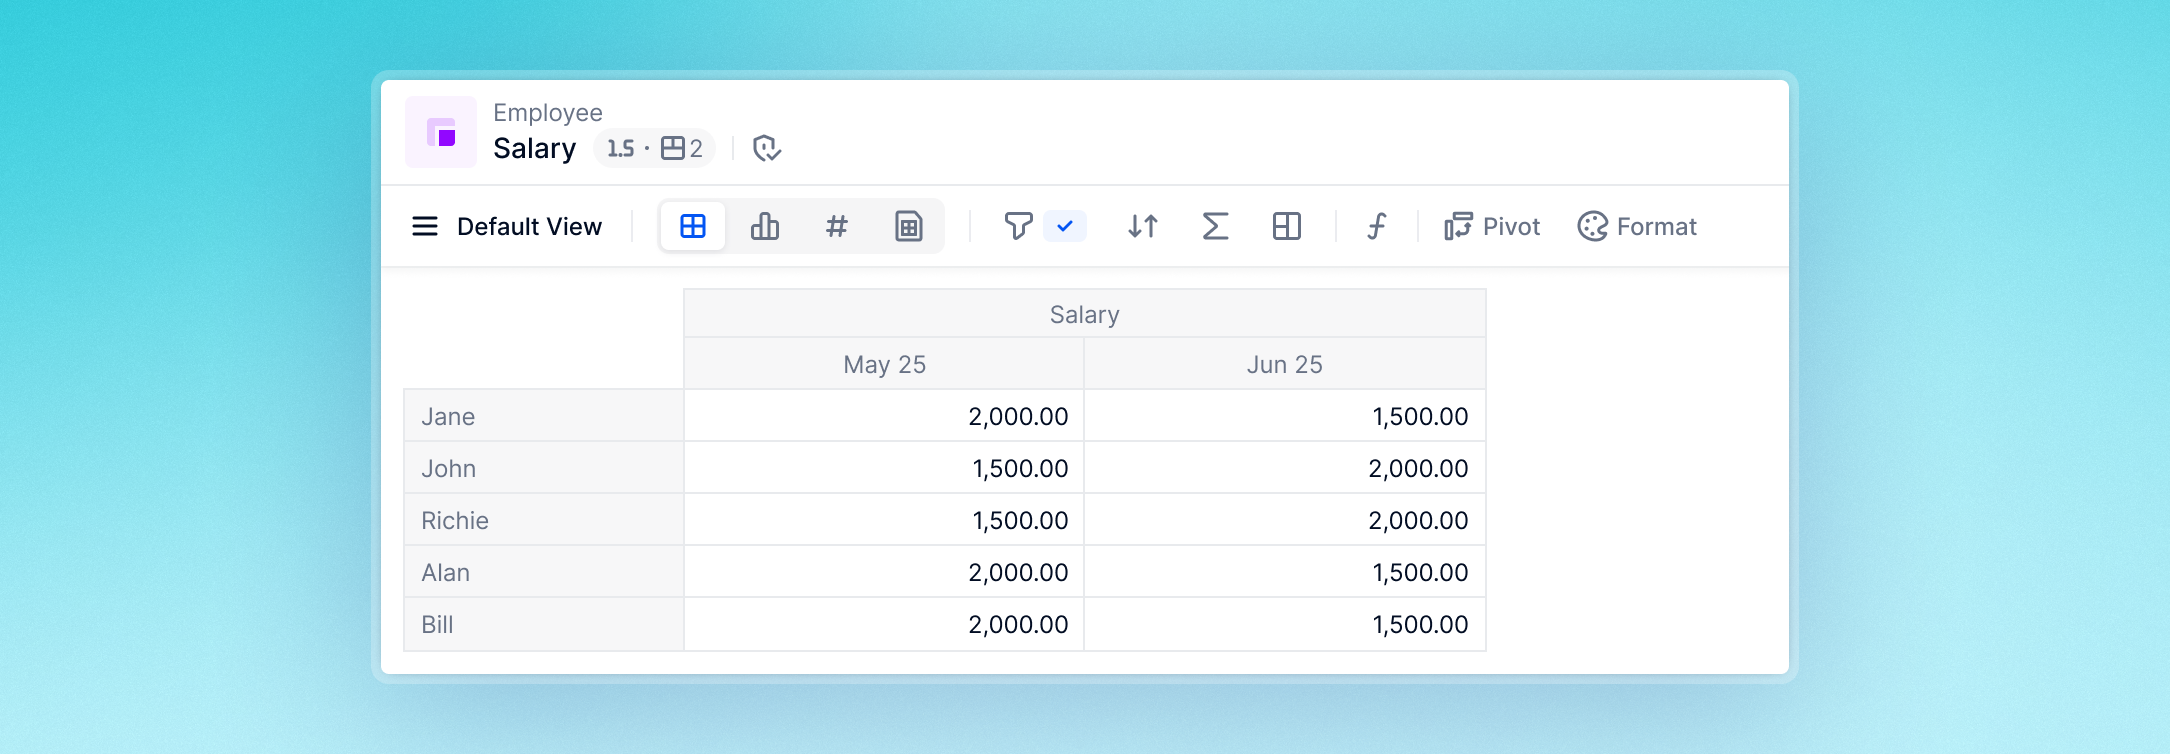
This use case looks at employees’ salaries stored in a Metric called Salary with Dimensions of Employee and Month.
.png)
You want to see the salary data by Team, a Dimension that is not in the Metric’s existing Dimension structure.
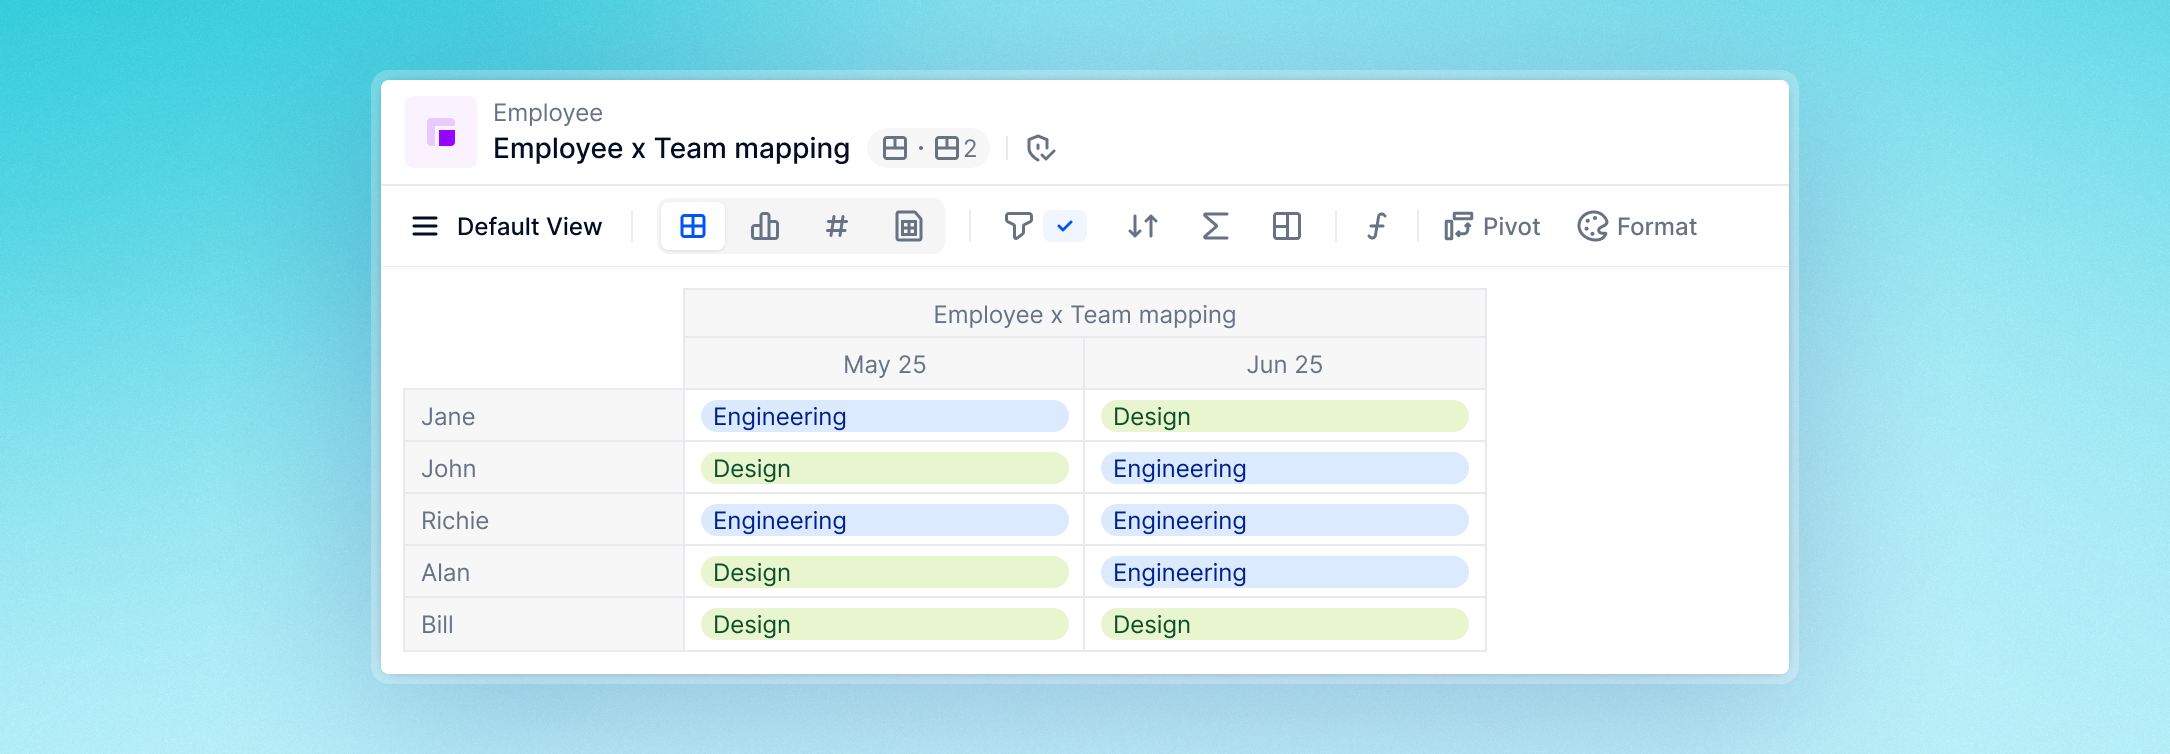
For this, you use a mapping Metric that sets out which employee is in which team by month:
.png)
You can then use Map a Dimension to the View to add the Team Dimension. This lets you view Salary defined on Employee and Month along with Team, as below.
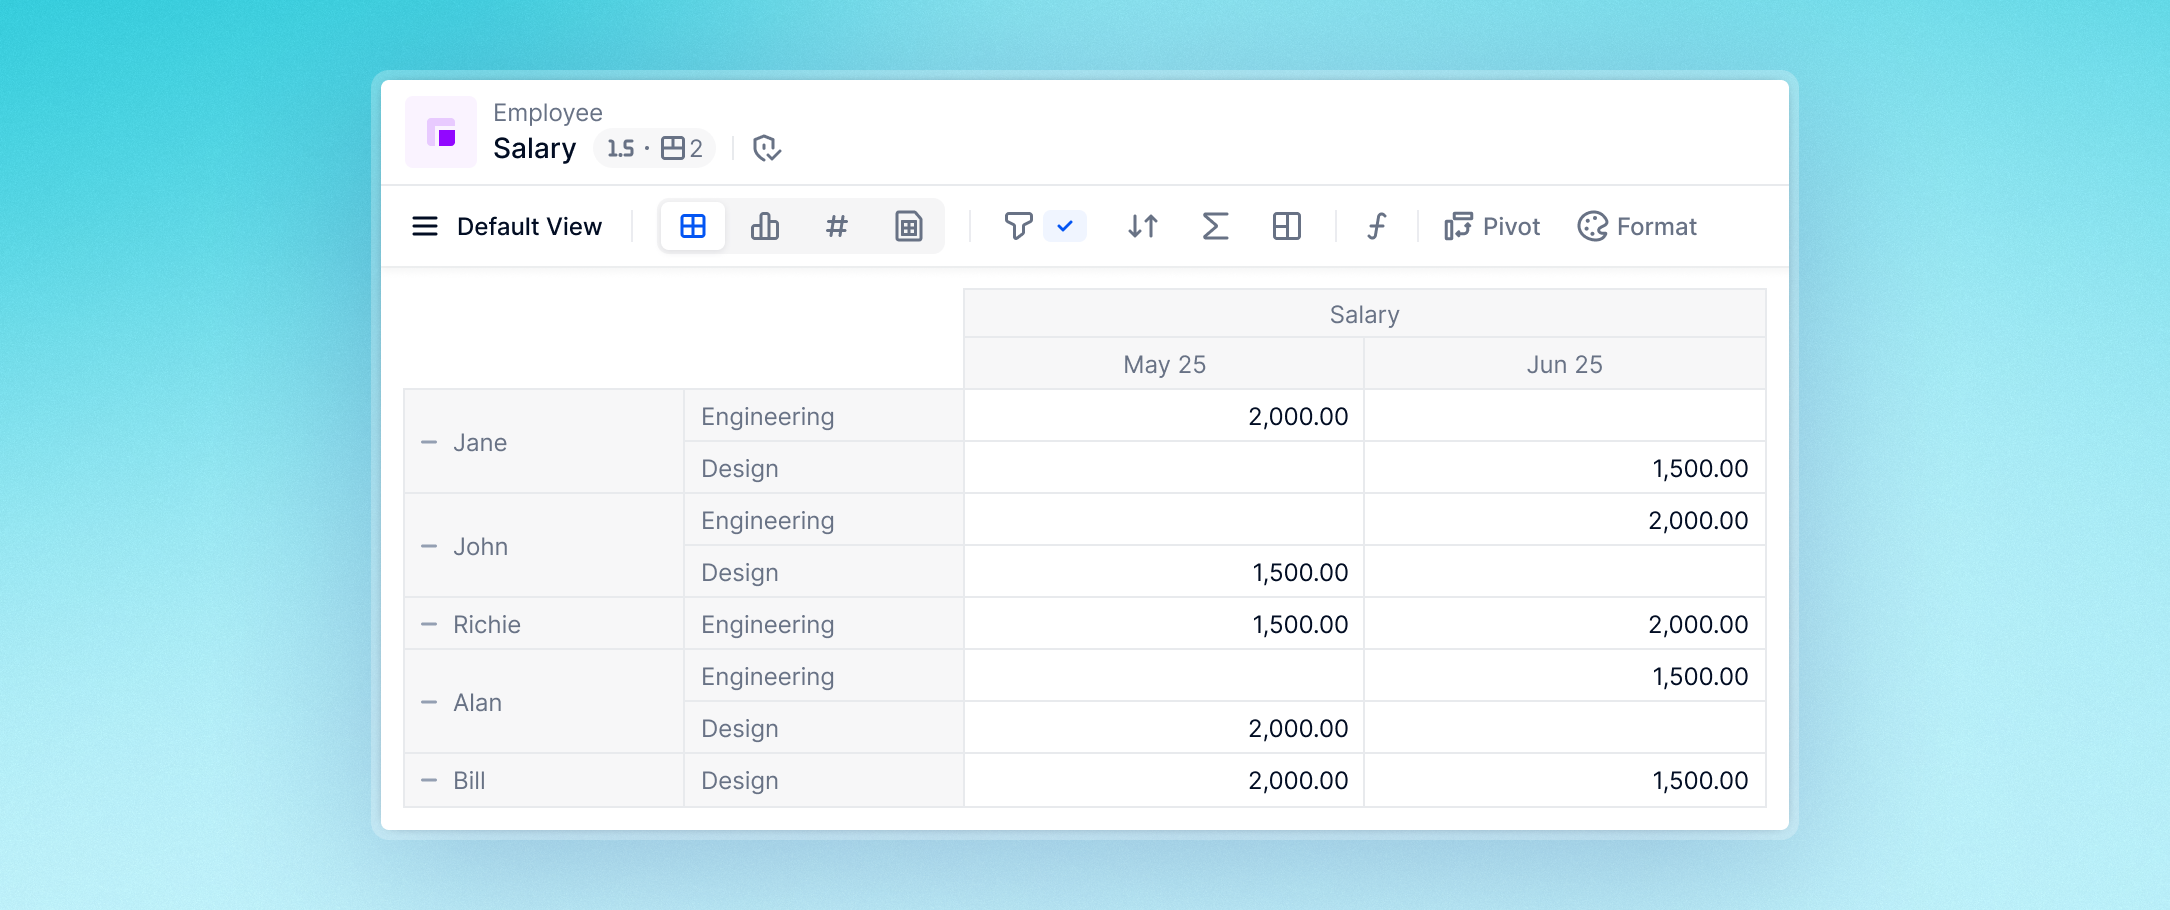
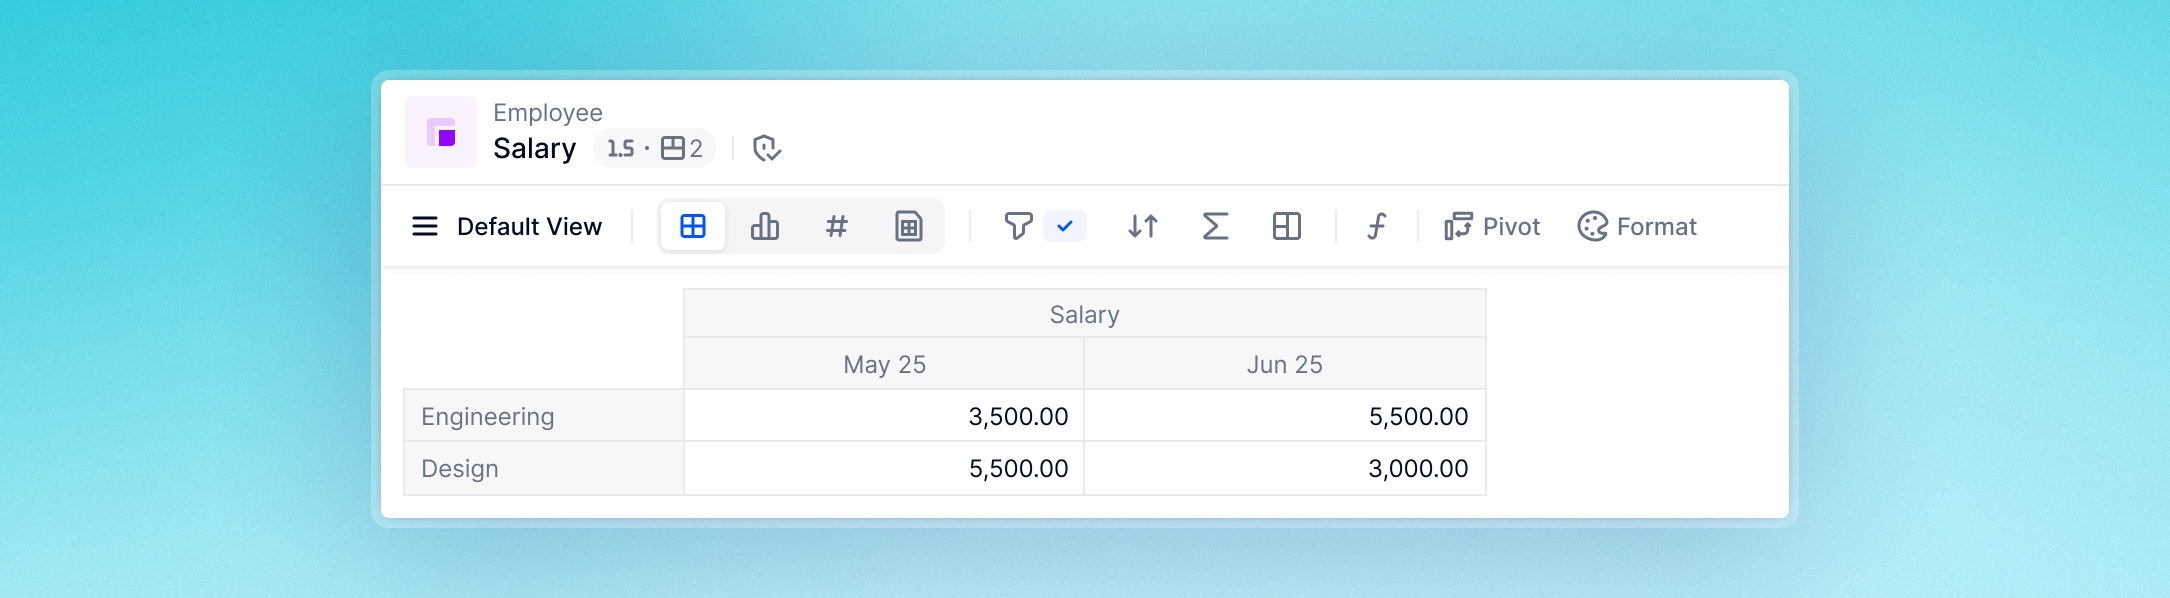
Or you can remove Employee from the View and just visualize data aggregated by Team, as here:
In a Table
A common and powerful use case for this feature is in Tables.
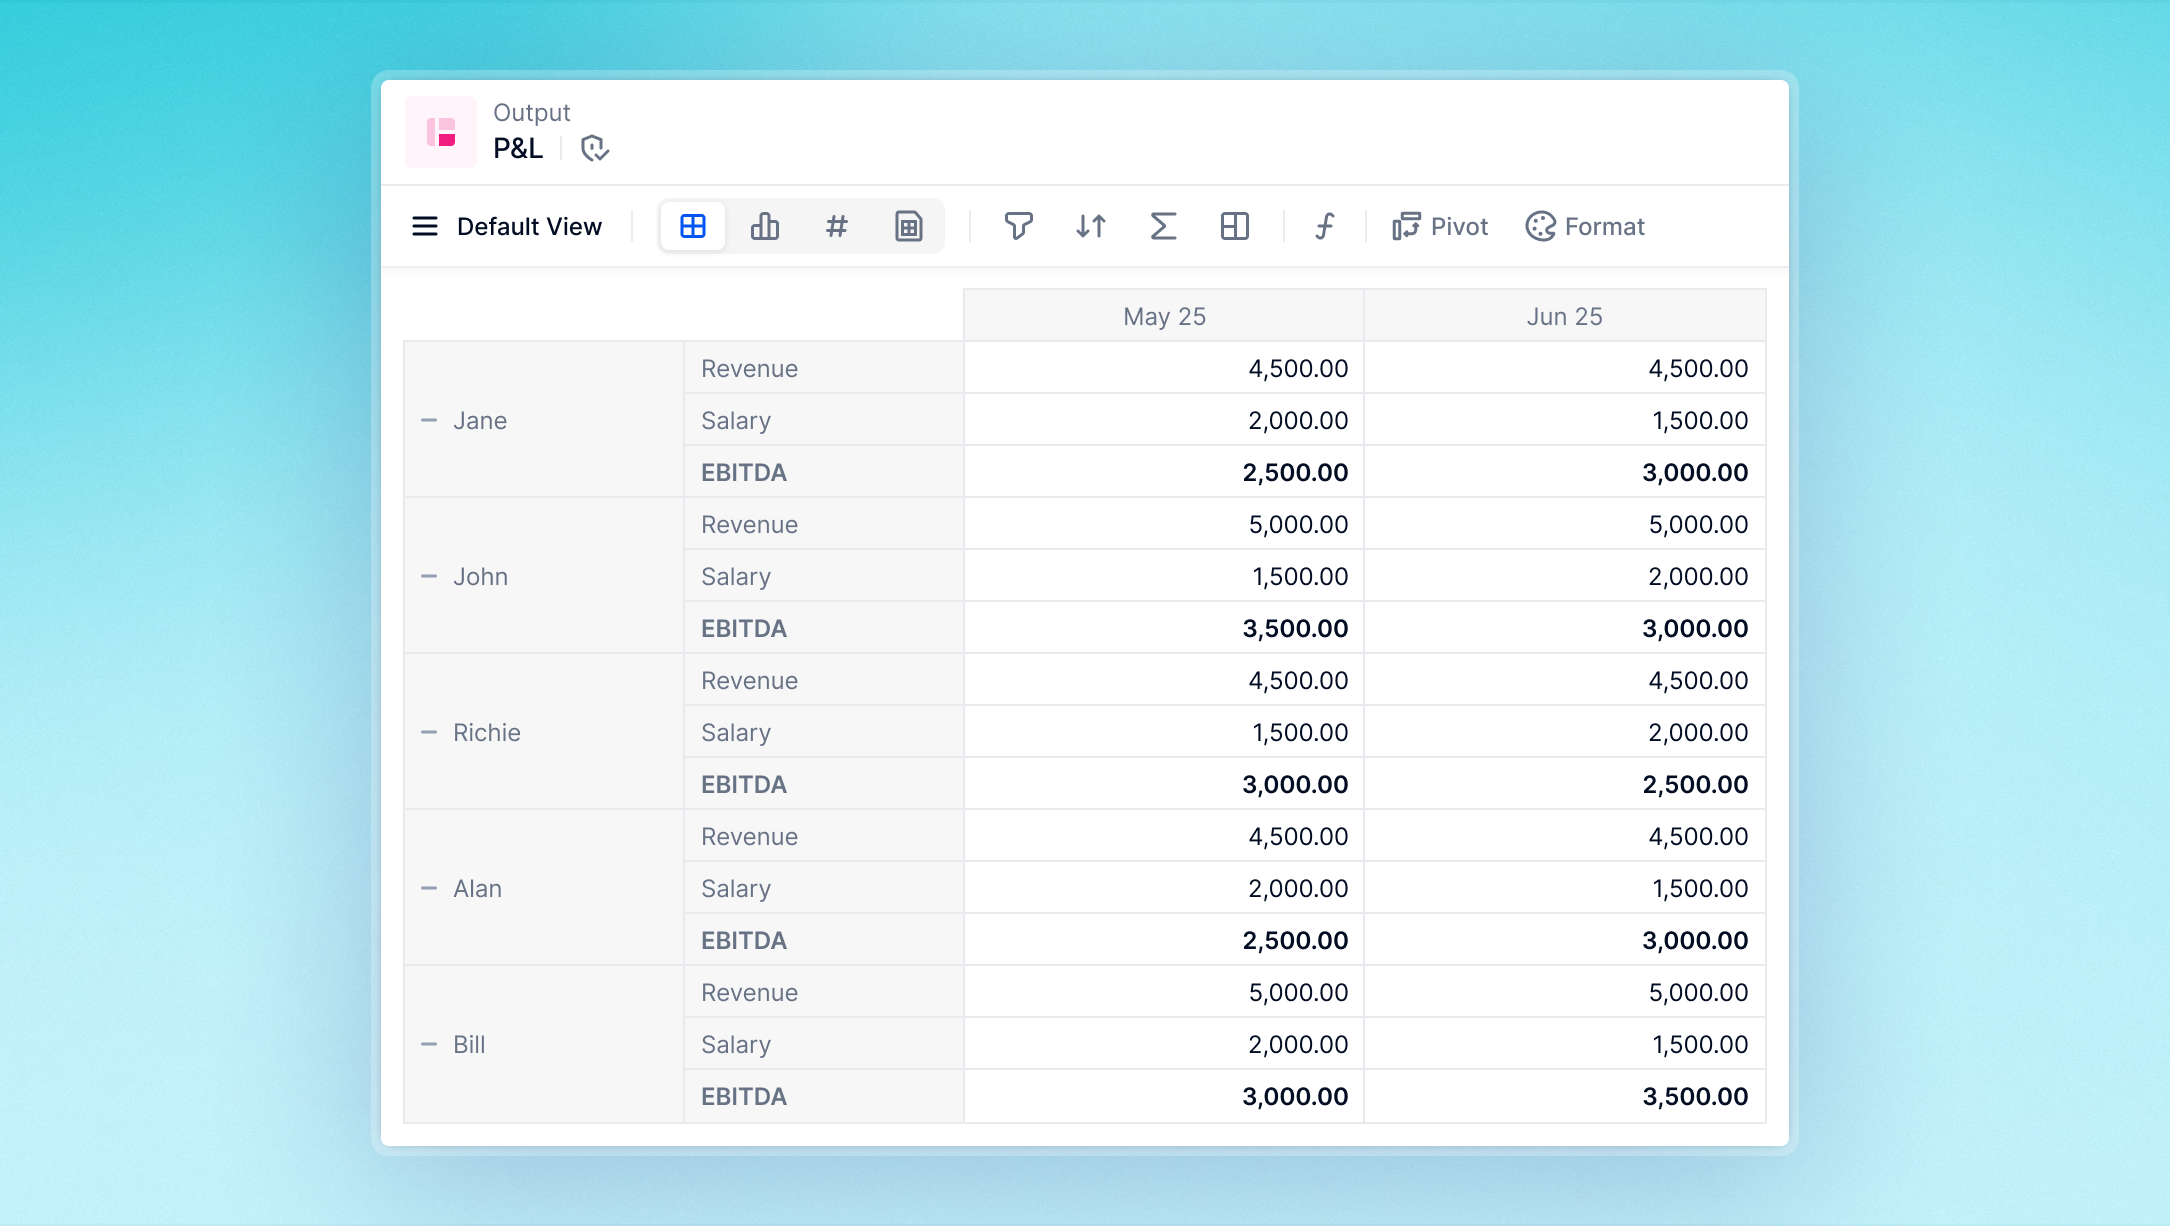
In this example, you have a Table with your Employees’ salaries set against the Revenue they bring in per month. You make a Table of the two Metrics. A Calculated Item provides an Employee-by-Employee EBITDA number:
.png)
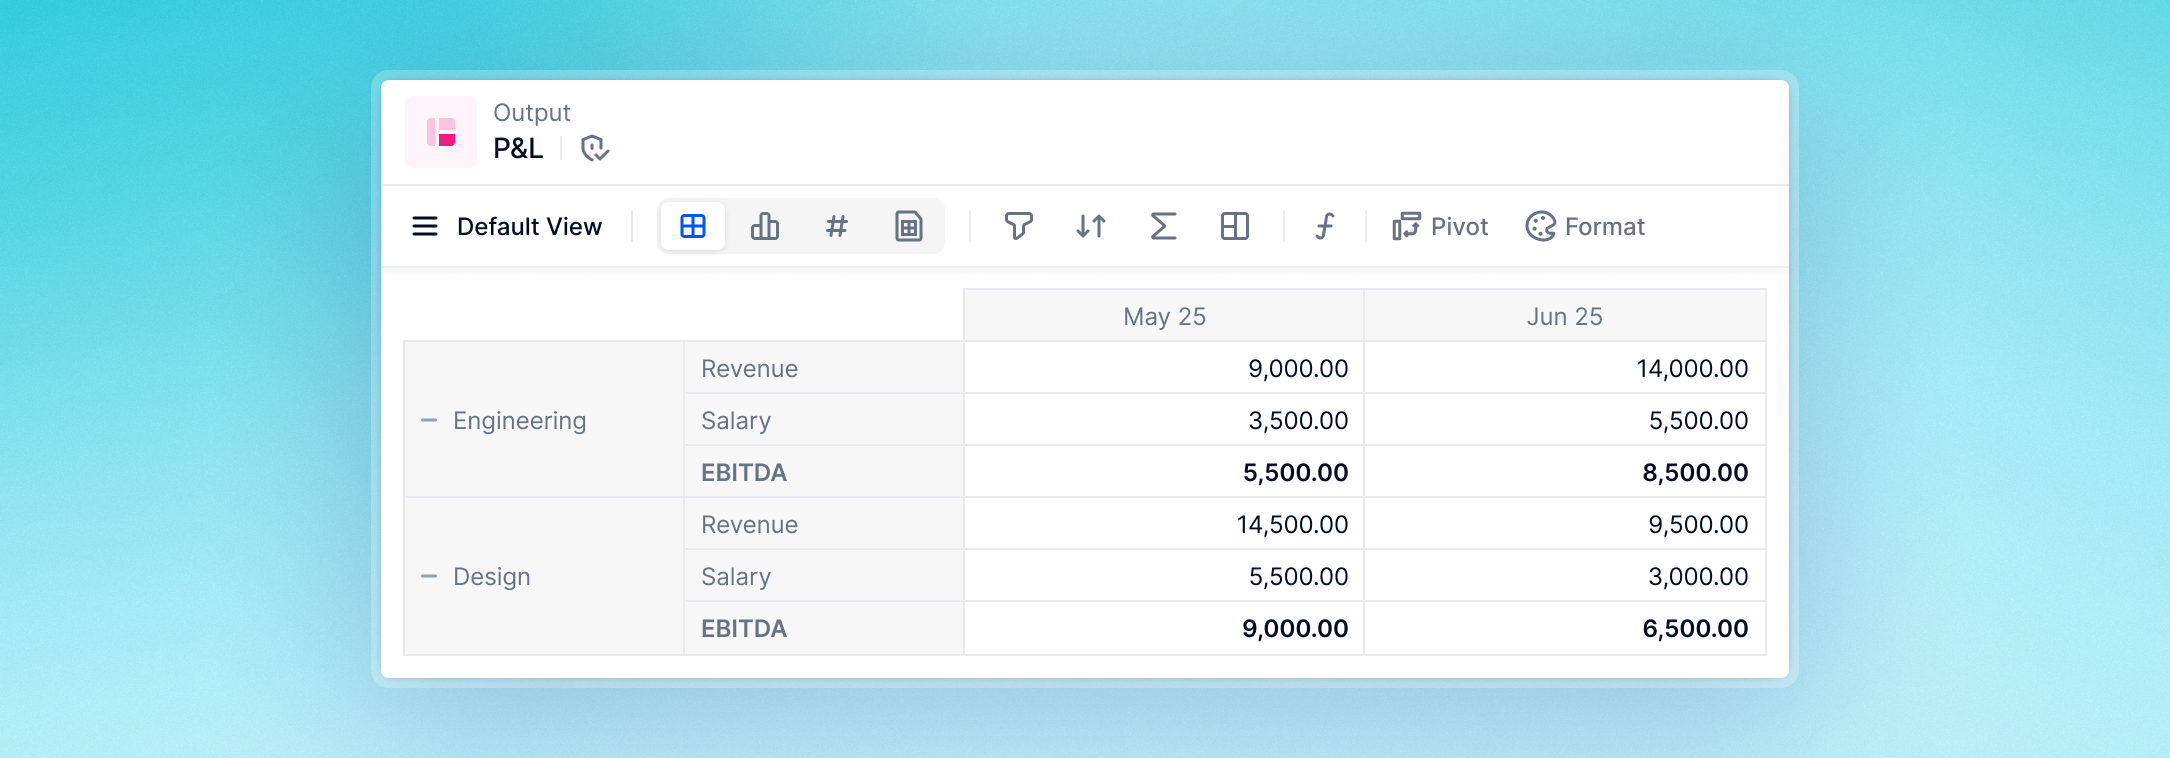
To view this data by Team, without mapped Dimensions, you would need to add the Team Dimension to each Metric in the Table. But by mapping the Team Dimension instead, you can achieve this result without altering the underlying model or its formulas. This approach also improves performance:
.png)
Set up mapped Dimensions
To set up mapped Dimensions using the example above, you need:
-
a Metric (in the above example, this was Salary) that contains at least two Dimensions.
-
a mapping Metric (Employee x Team Mapping in the example), whose Dimensions are present in the first Metric. It has a data type of Dimension (Team in the example).
The example shows mapping between just two Dimensions (Employee and Team) but multiple Dimensions are possible.
Important
Mapping Metrics used for mapped Dimensions cannot include any Dimensions that do not appear in the first Metric.
Add the Dimension to a View
-
In your Metric, open the Pivot panel.
-
Select the + beside Row or Column according to where you’d like your mapped Dimension to appear.
-
Select Map a Dimension to the View (see image below).
-
A dialog opens providing a dropdown of your Application’s Dimensions. Select the Dimension you wish to add.
-
A mapping Metric selector appears in the next field. It only contains mapping Metrics whose Dimensions match those of one or more Metrics currently available in the View. Select the applicable mapping Metric.
-
Your mapped Dimension appears with an arrow
.png) symbol showing that it is external to your Block.
symbol showing that it is external to your Block..png)

Behavior
-
Once added to a Table, a mapped Dimension is available to all Metrics that share the mapping Metric’s Dimensions. You do not need to reconfigure mapped Dimensions for subsequent uses.
-
You can add multiple mapped Dimensions to a single View, on the same source Dimensions, or on others.
-
A Dimension added through mapped Dimensions has the same functionality as Dimensions added in the normal way, including:
-
Filters
-
Calculated Items
-
Show values as
-
Page selectors
-