


This May, we have exciting news features to share, from formatting improvements, enhanced ways of visualizing your data, to new AI and Agentic updates designed to accelerate your developments.
- 🚀 Intent Modeling Certification is now live
- 🌐 Register today for the Quarterly Product Webinar
- 🔄 Reuse Data Actions with flexible Parameters
- 🤖 Add Lists to your Agents' analyses
- 🛑 Stop an Agent mid-answer
- 🔎 Analyze all Metric types with Agents
- 👤 Ask the Modeler who changed what
- ⚡ Speed up your Modeler work
- 🌈 Color charts by Dimension Items
- 📐 Hierarchy View Templates
- 📊 Chart improvements: Waterfall charts
- 🎥 Upcoming customer webinars
- 🎙️ Meet the minds behind the numbers
Intent Modeling Certification is now live

Shift from manual builder to strategic architect with our newest learning path in Pigment Academy. Module 0 establishes the conceptual foundation needed to transition to intent-driven design. Learn to seamlessly collaborate with the Modeler Agent, articulate business rules, and generate foundational architectures in a fraction of the time.
Get started today: Intent Modeling Certification
Register today for the Quarterly Product Webinar
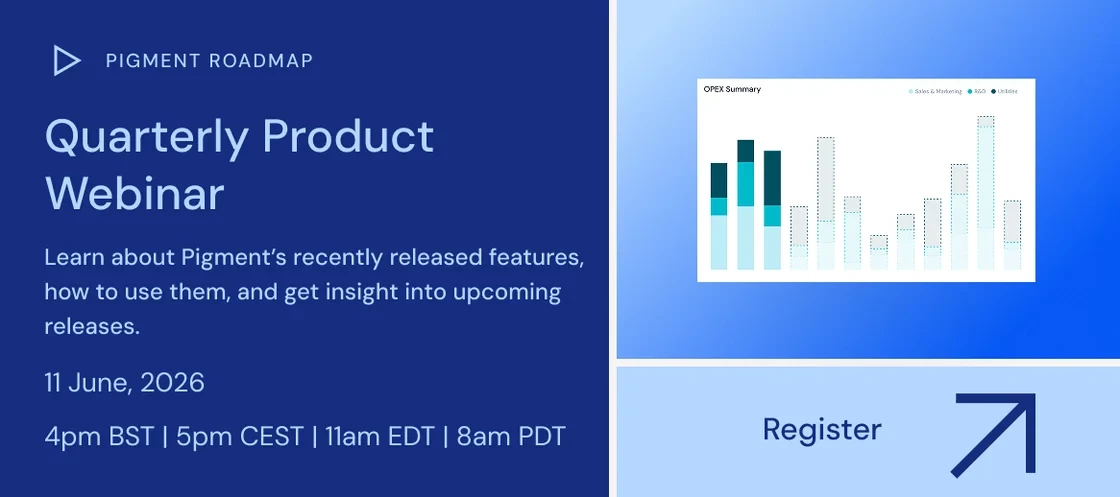
Our second product webinar of the year will take place on June 11th (8:00am PDT | 11:00am PDT | 4:00pm BST | 5:00pm CEST). Our experts will walk through the latest enhancements to Pigment Agents, showcase new foundational features to keep your models running smoothly, and demo updates to UX and data visualization, including advanced aggregator.
Reuse Data Actions with flexible Parameters
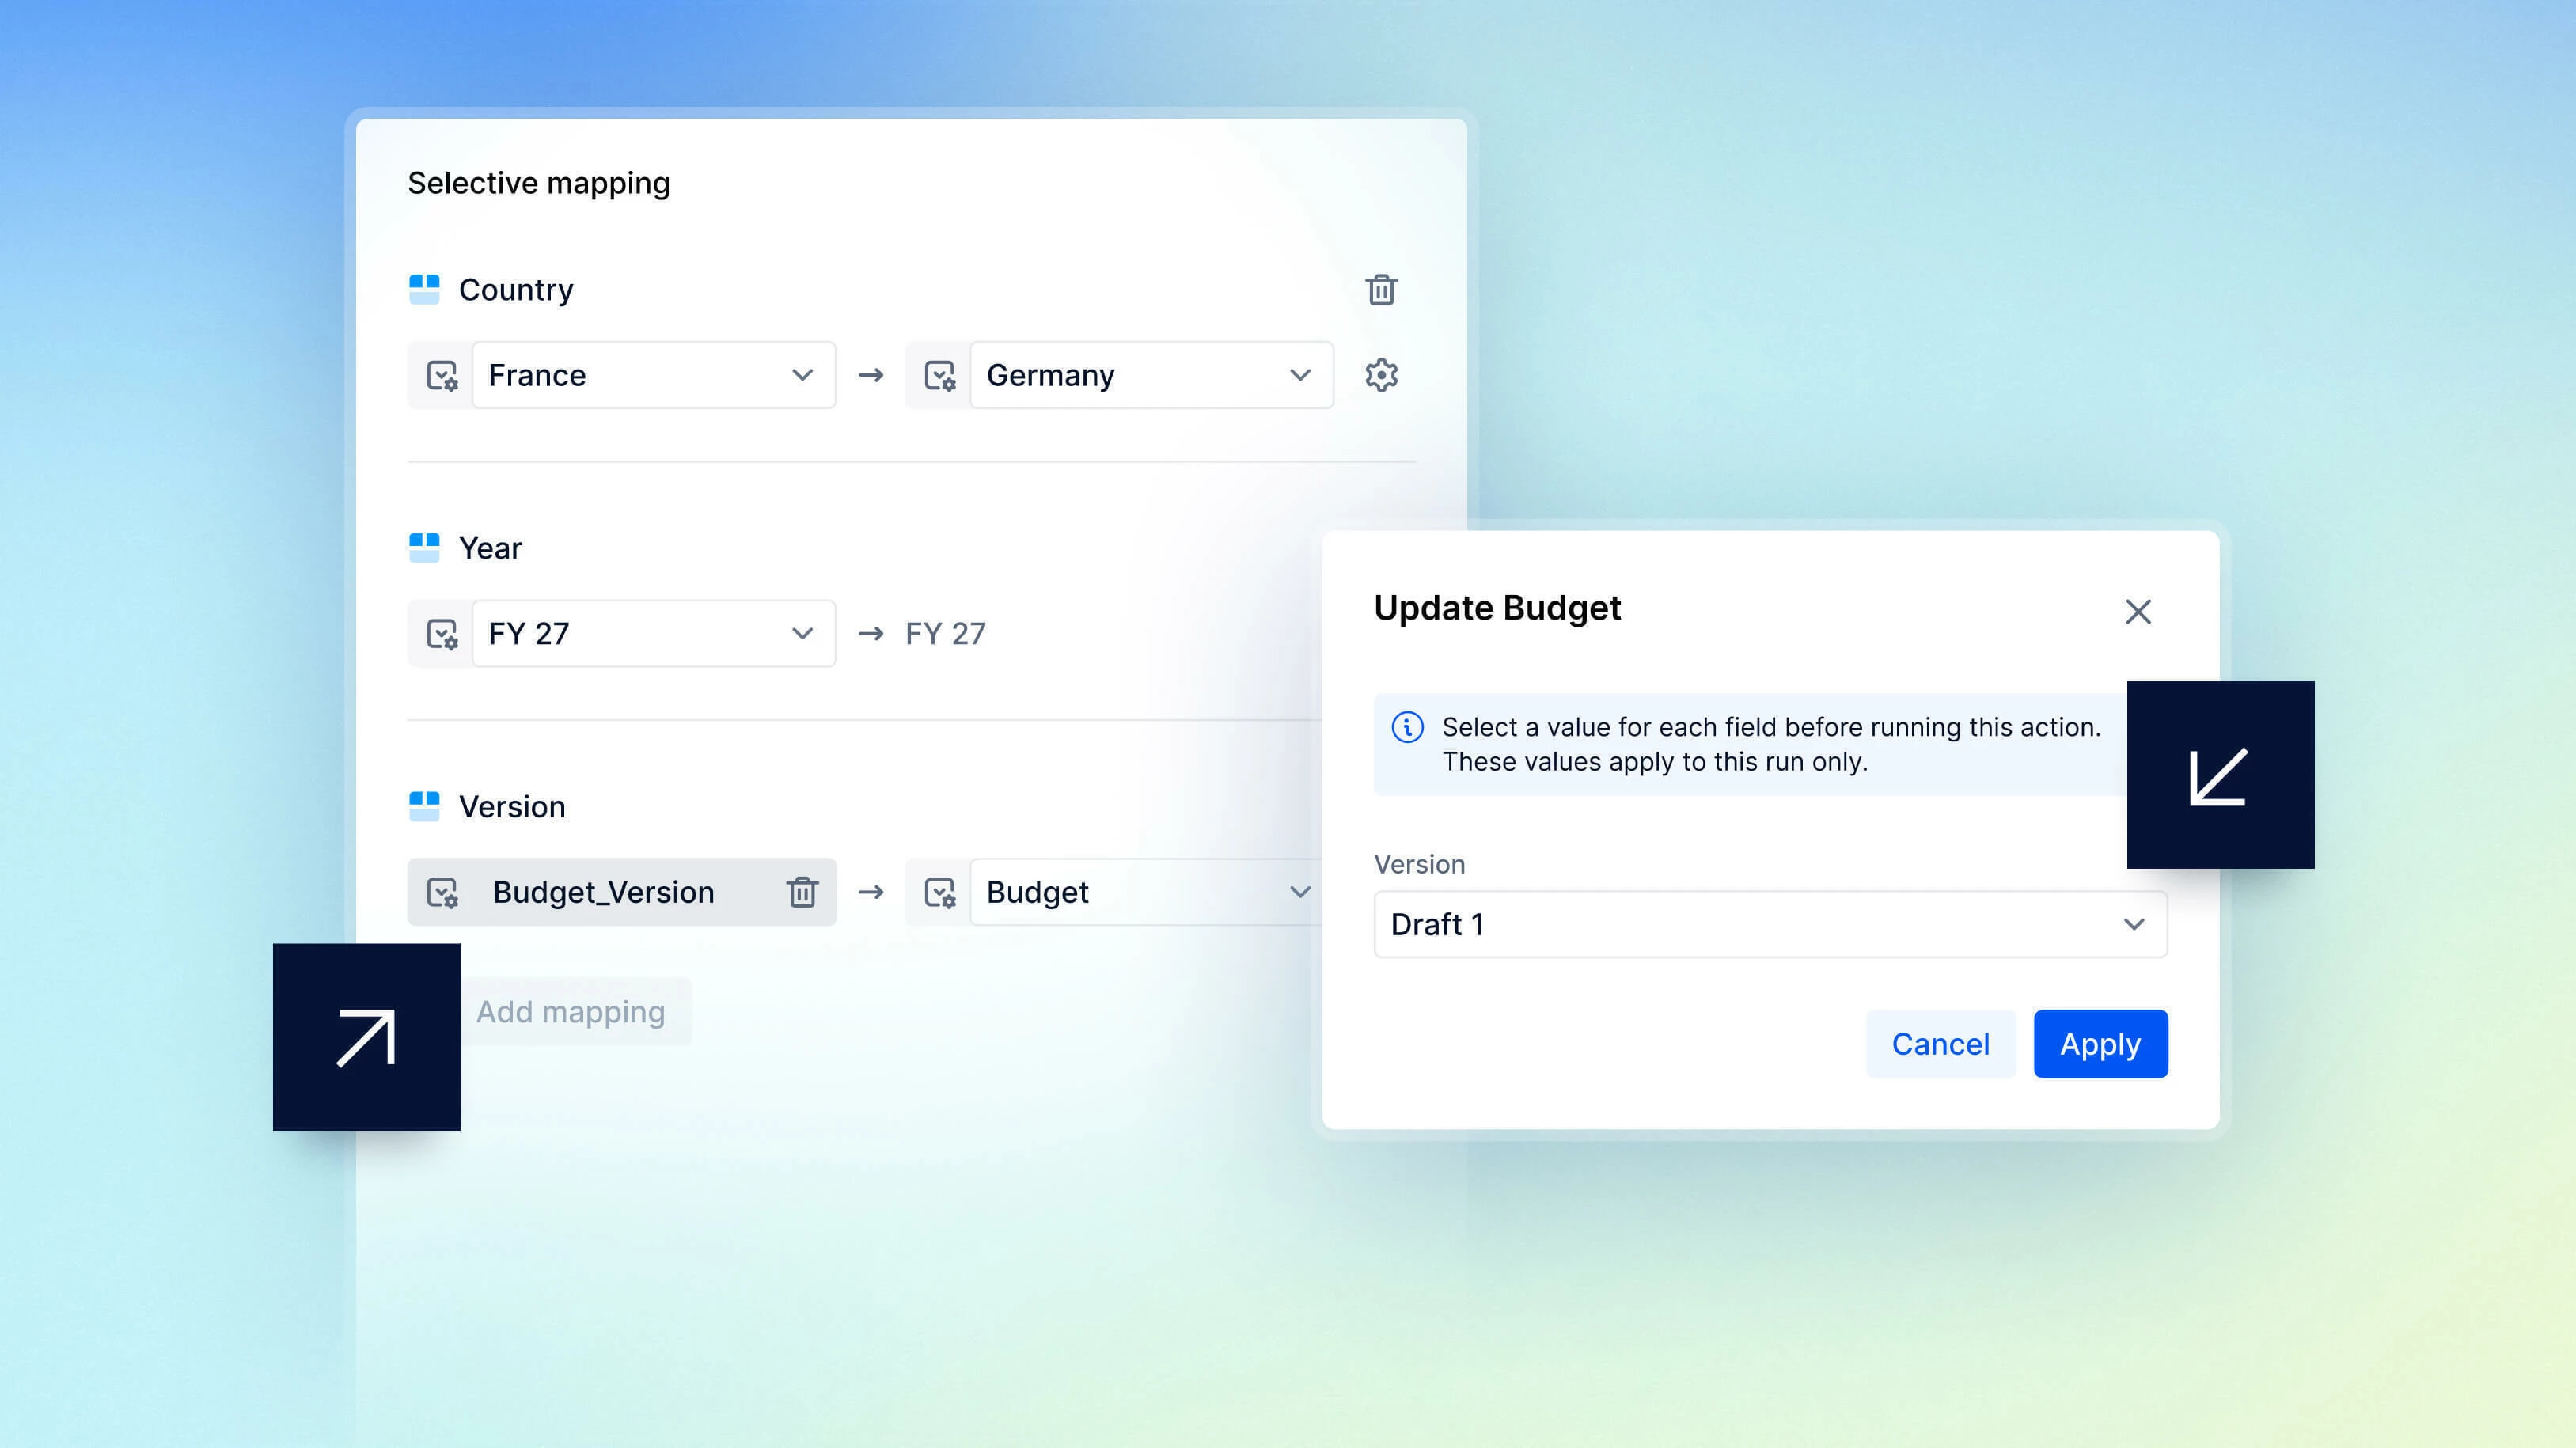
Create flexible, reusable Data Actions with Parameters. Instead of updating mappings manually or creating multiple configurations, Members can choose Dimension values each time they run a Data Action. Parameters are configured once at the Application level and reused across multiple Data Actions.
Add Lists to your Agents' analyses
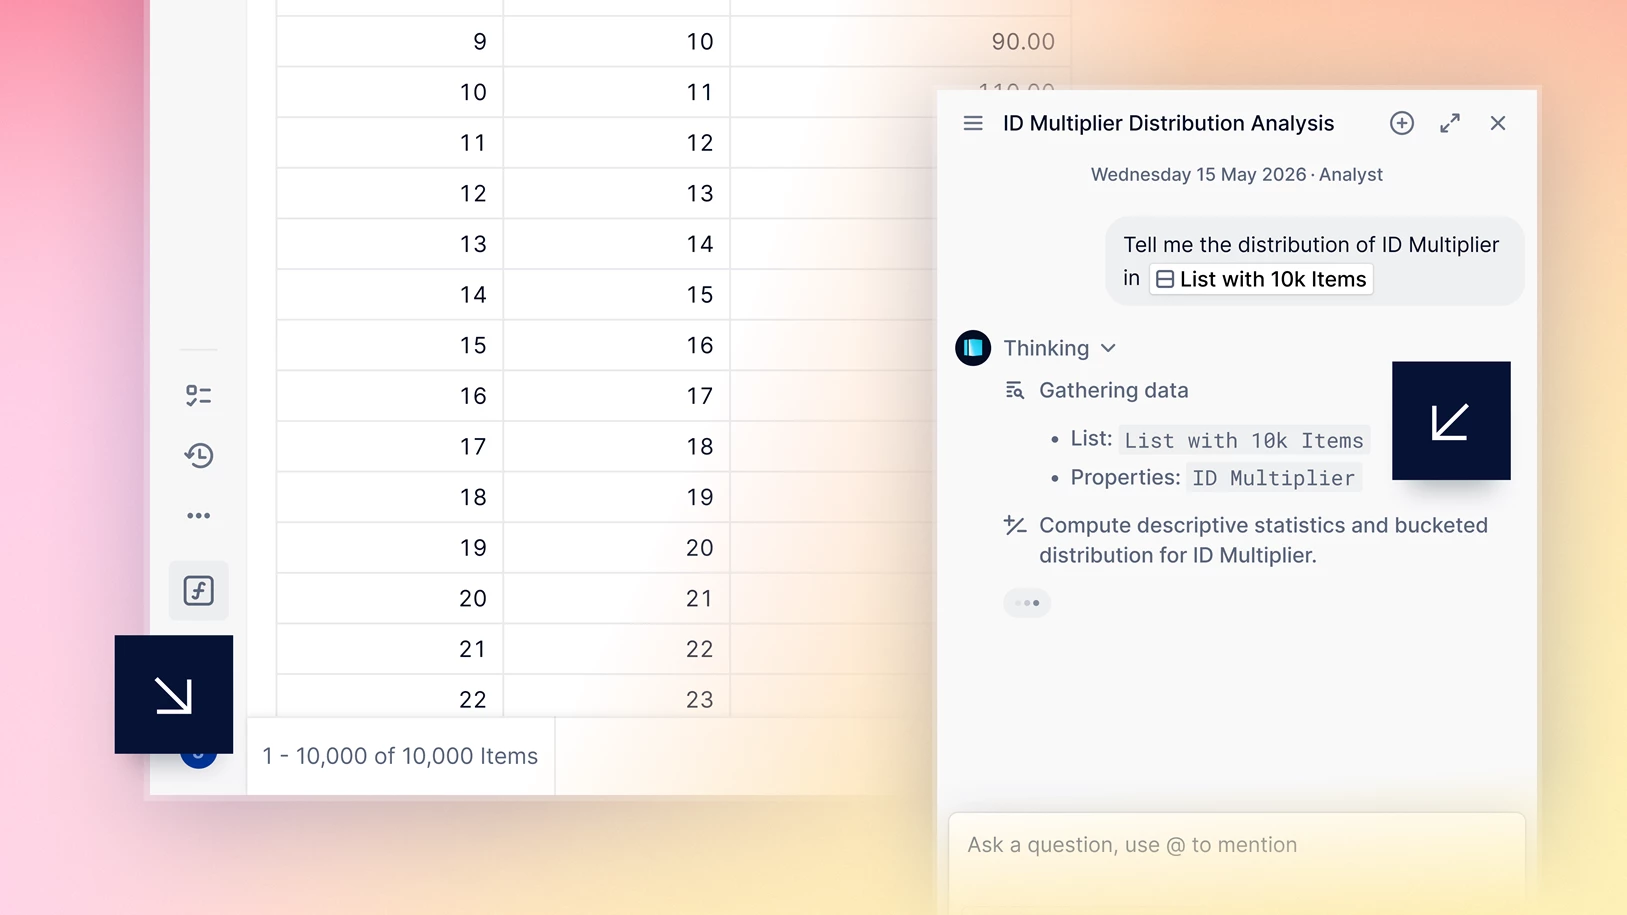
Agents can now work directly with your Dimension Lists and Transaction Lists—not just Metrics. The Analyst Agent and Custom Agents can pull up to 1,000,000 rows of raw List data, making it easier to analyze transactions, employee records, pipeline details, and other line-item data at scale.
Stop an Agent mid-answer
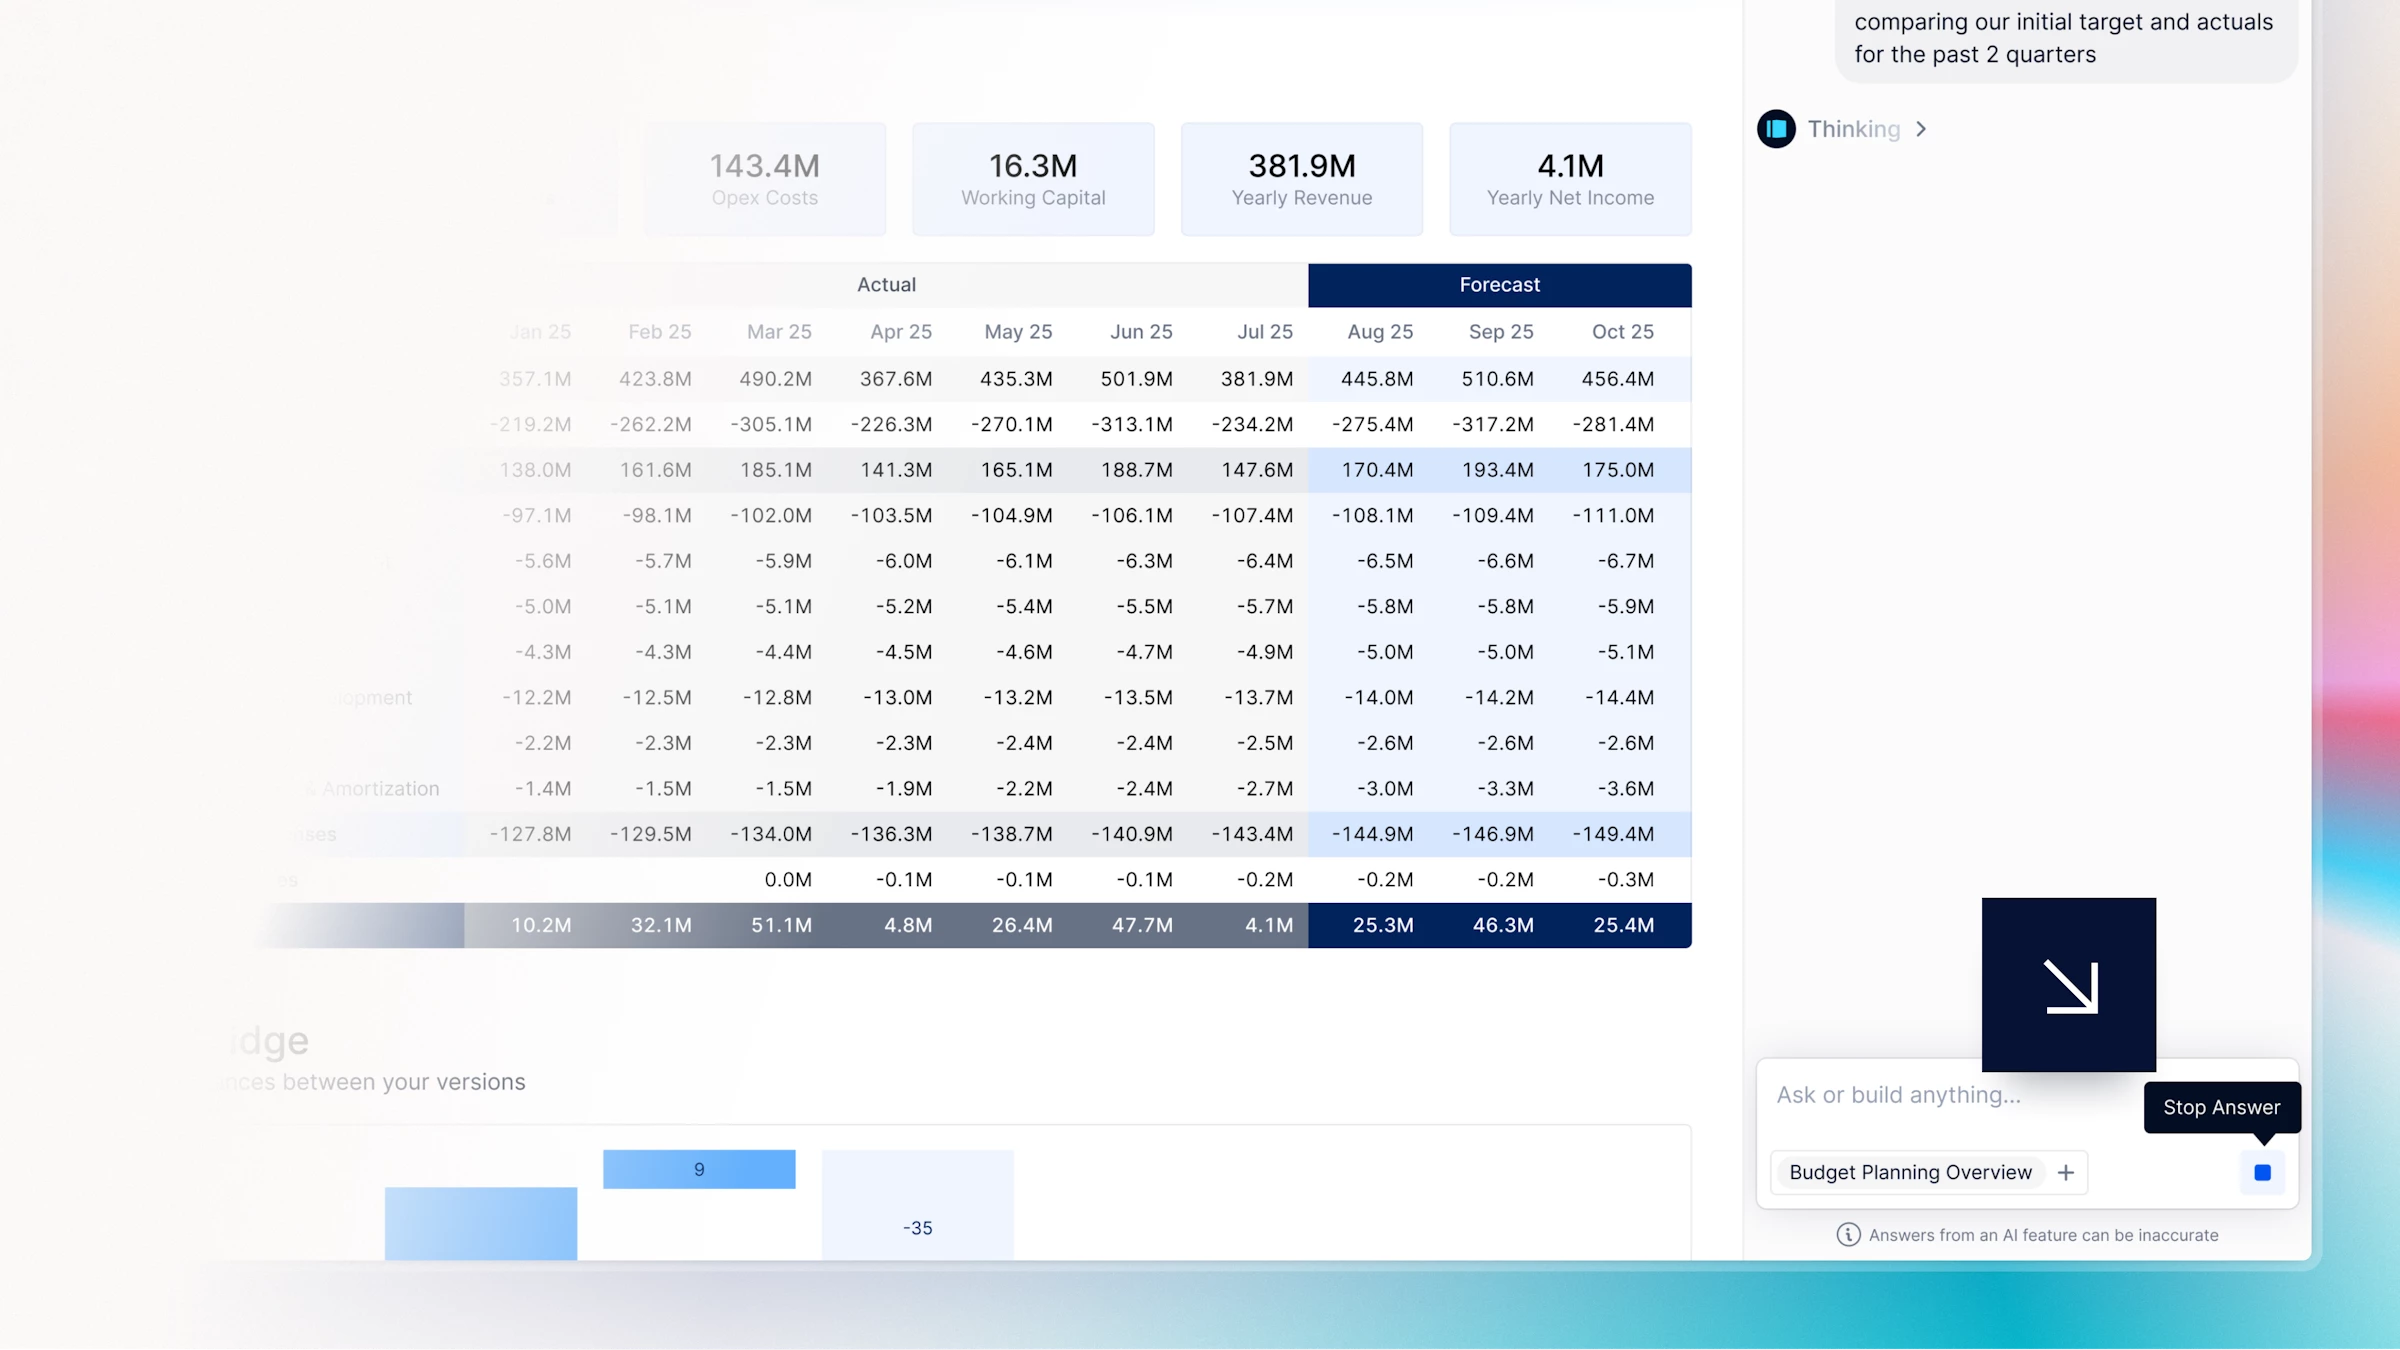
You can now stop an Agent while it’s preparing an answer, making it easier to correct prompts, interrupt long-running workflows, or manage token usage. Gain more control over Agent behavior without waiting for a run to finish. Available for Modeler, Analyst, Documentation, and Custom Agents.
Analyze all Metric types with Agents
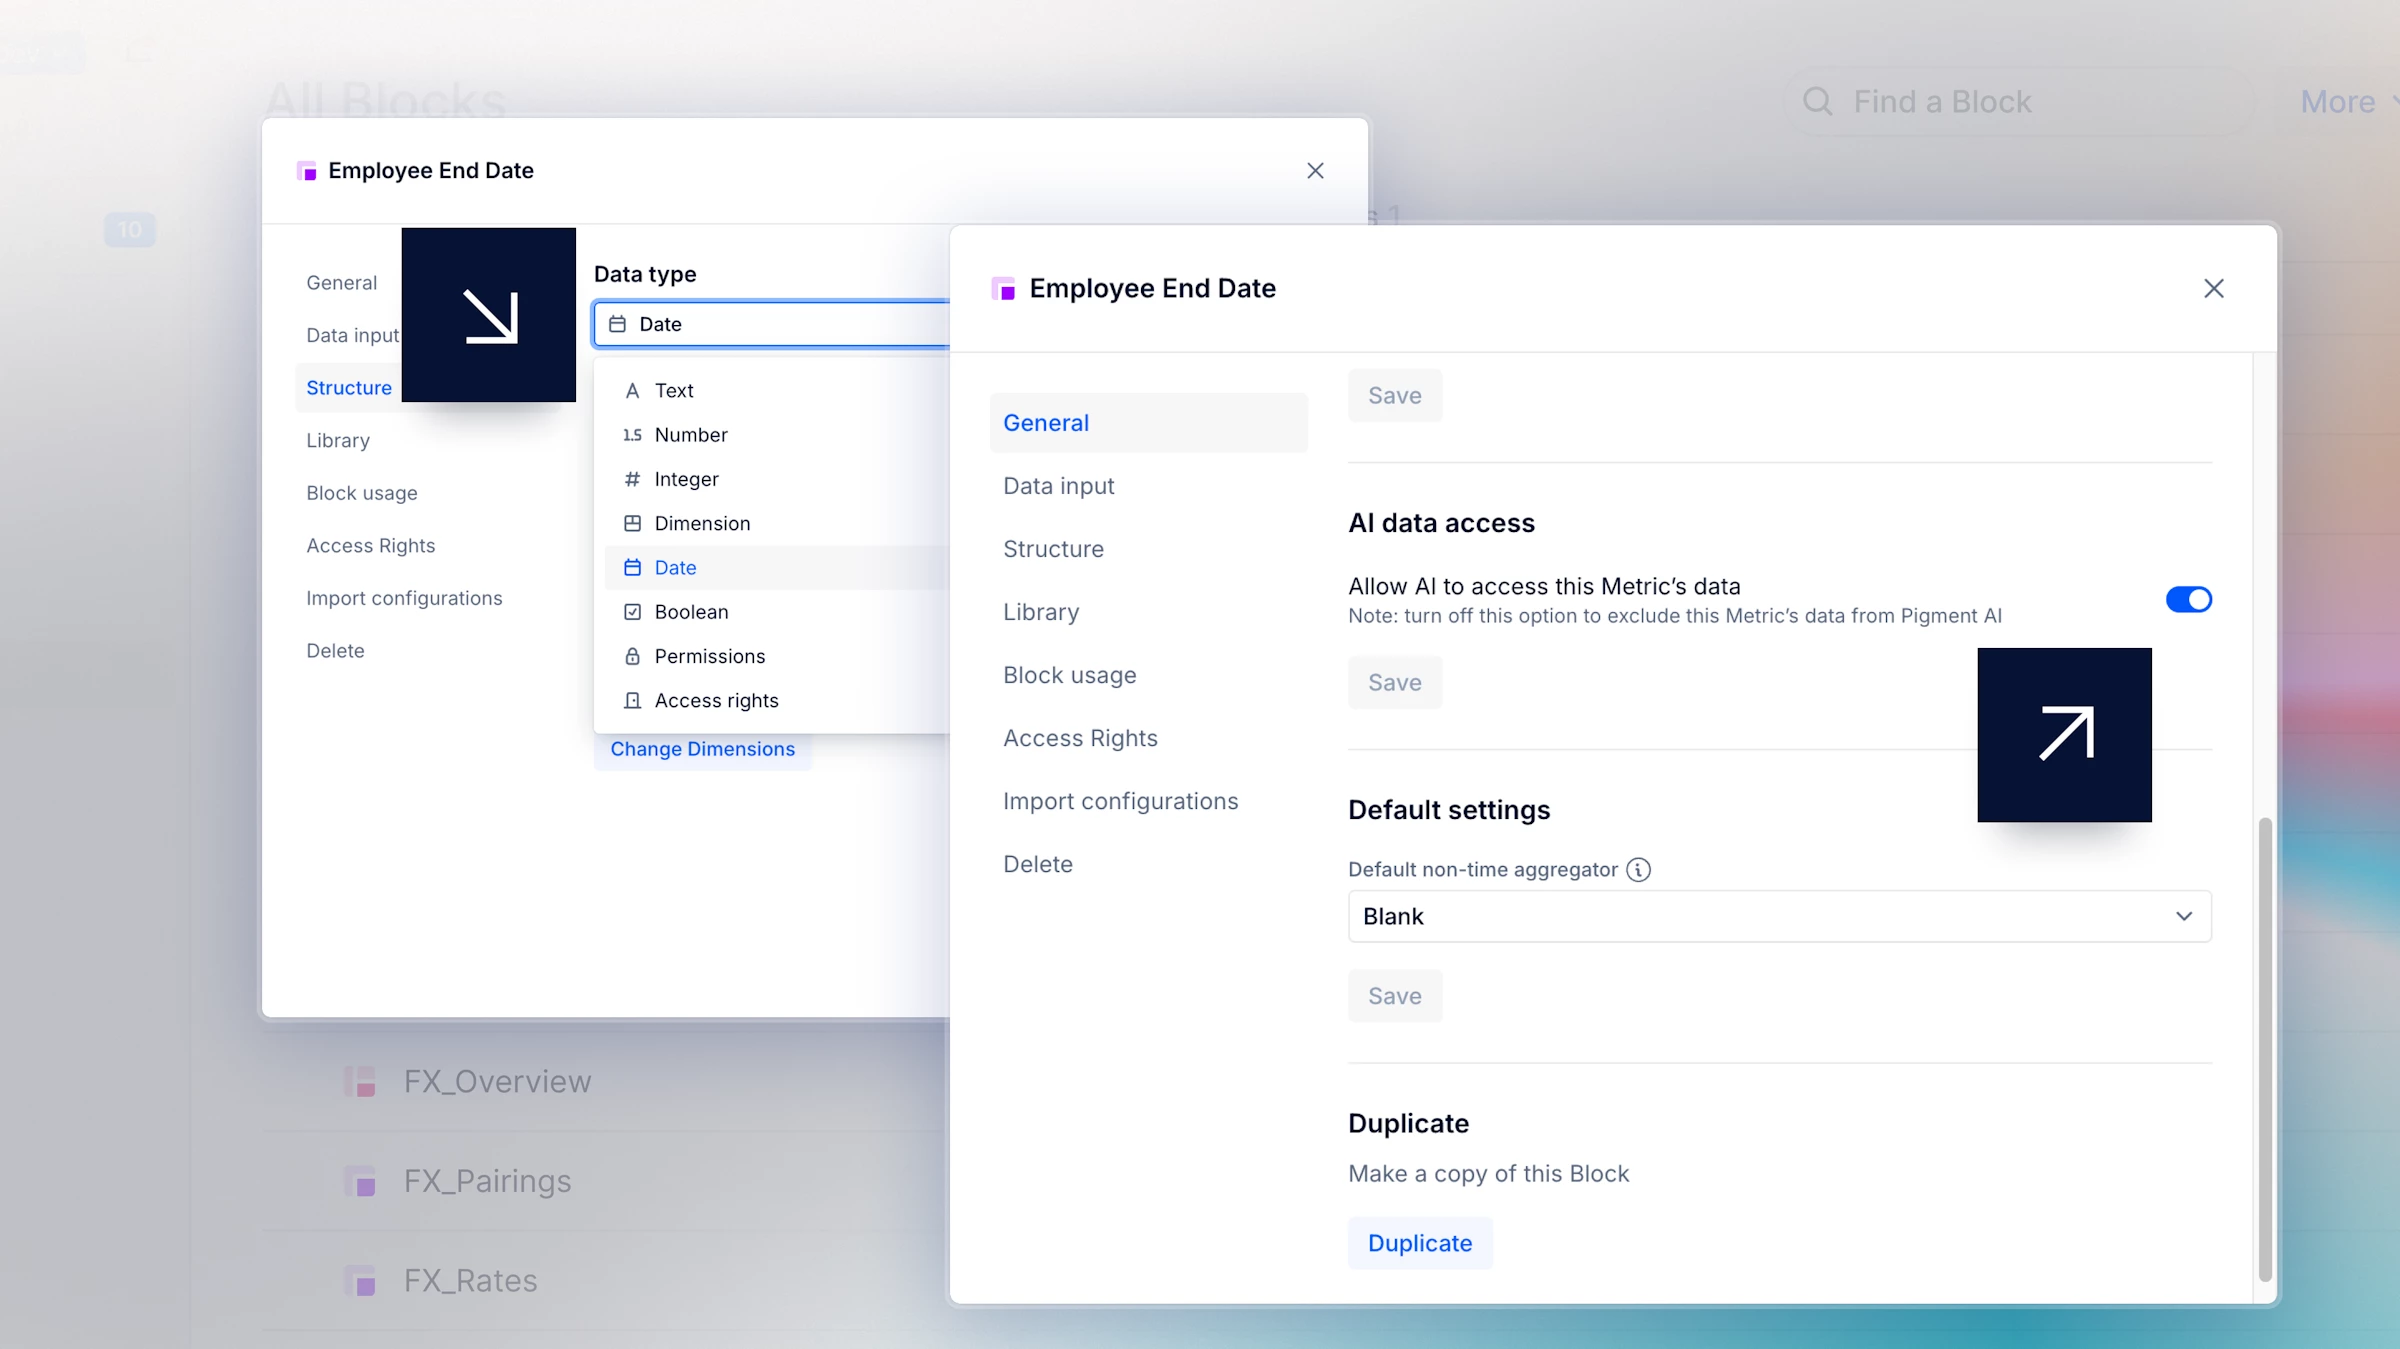
The Analyst and the Custom Agents can now read all Metric types. Previously limited to Date, Text, Number, and Integer Metrics, they now also support Dimension, Boolean, Access Rights, and Permissions Metrics. This means Agents analyze a broader dataset and generate richer outputs.
Ask the Modeler who changed what
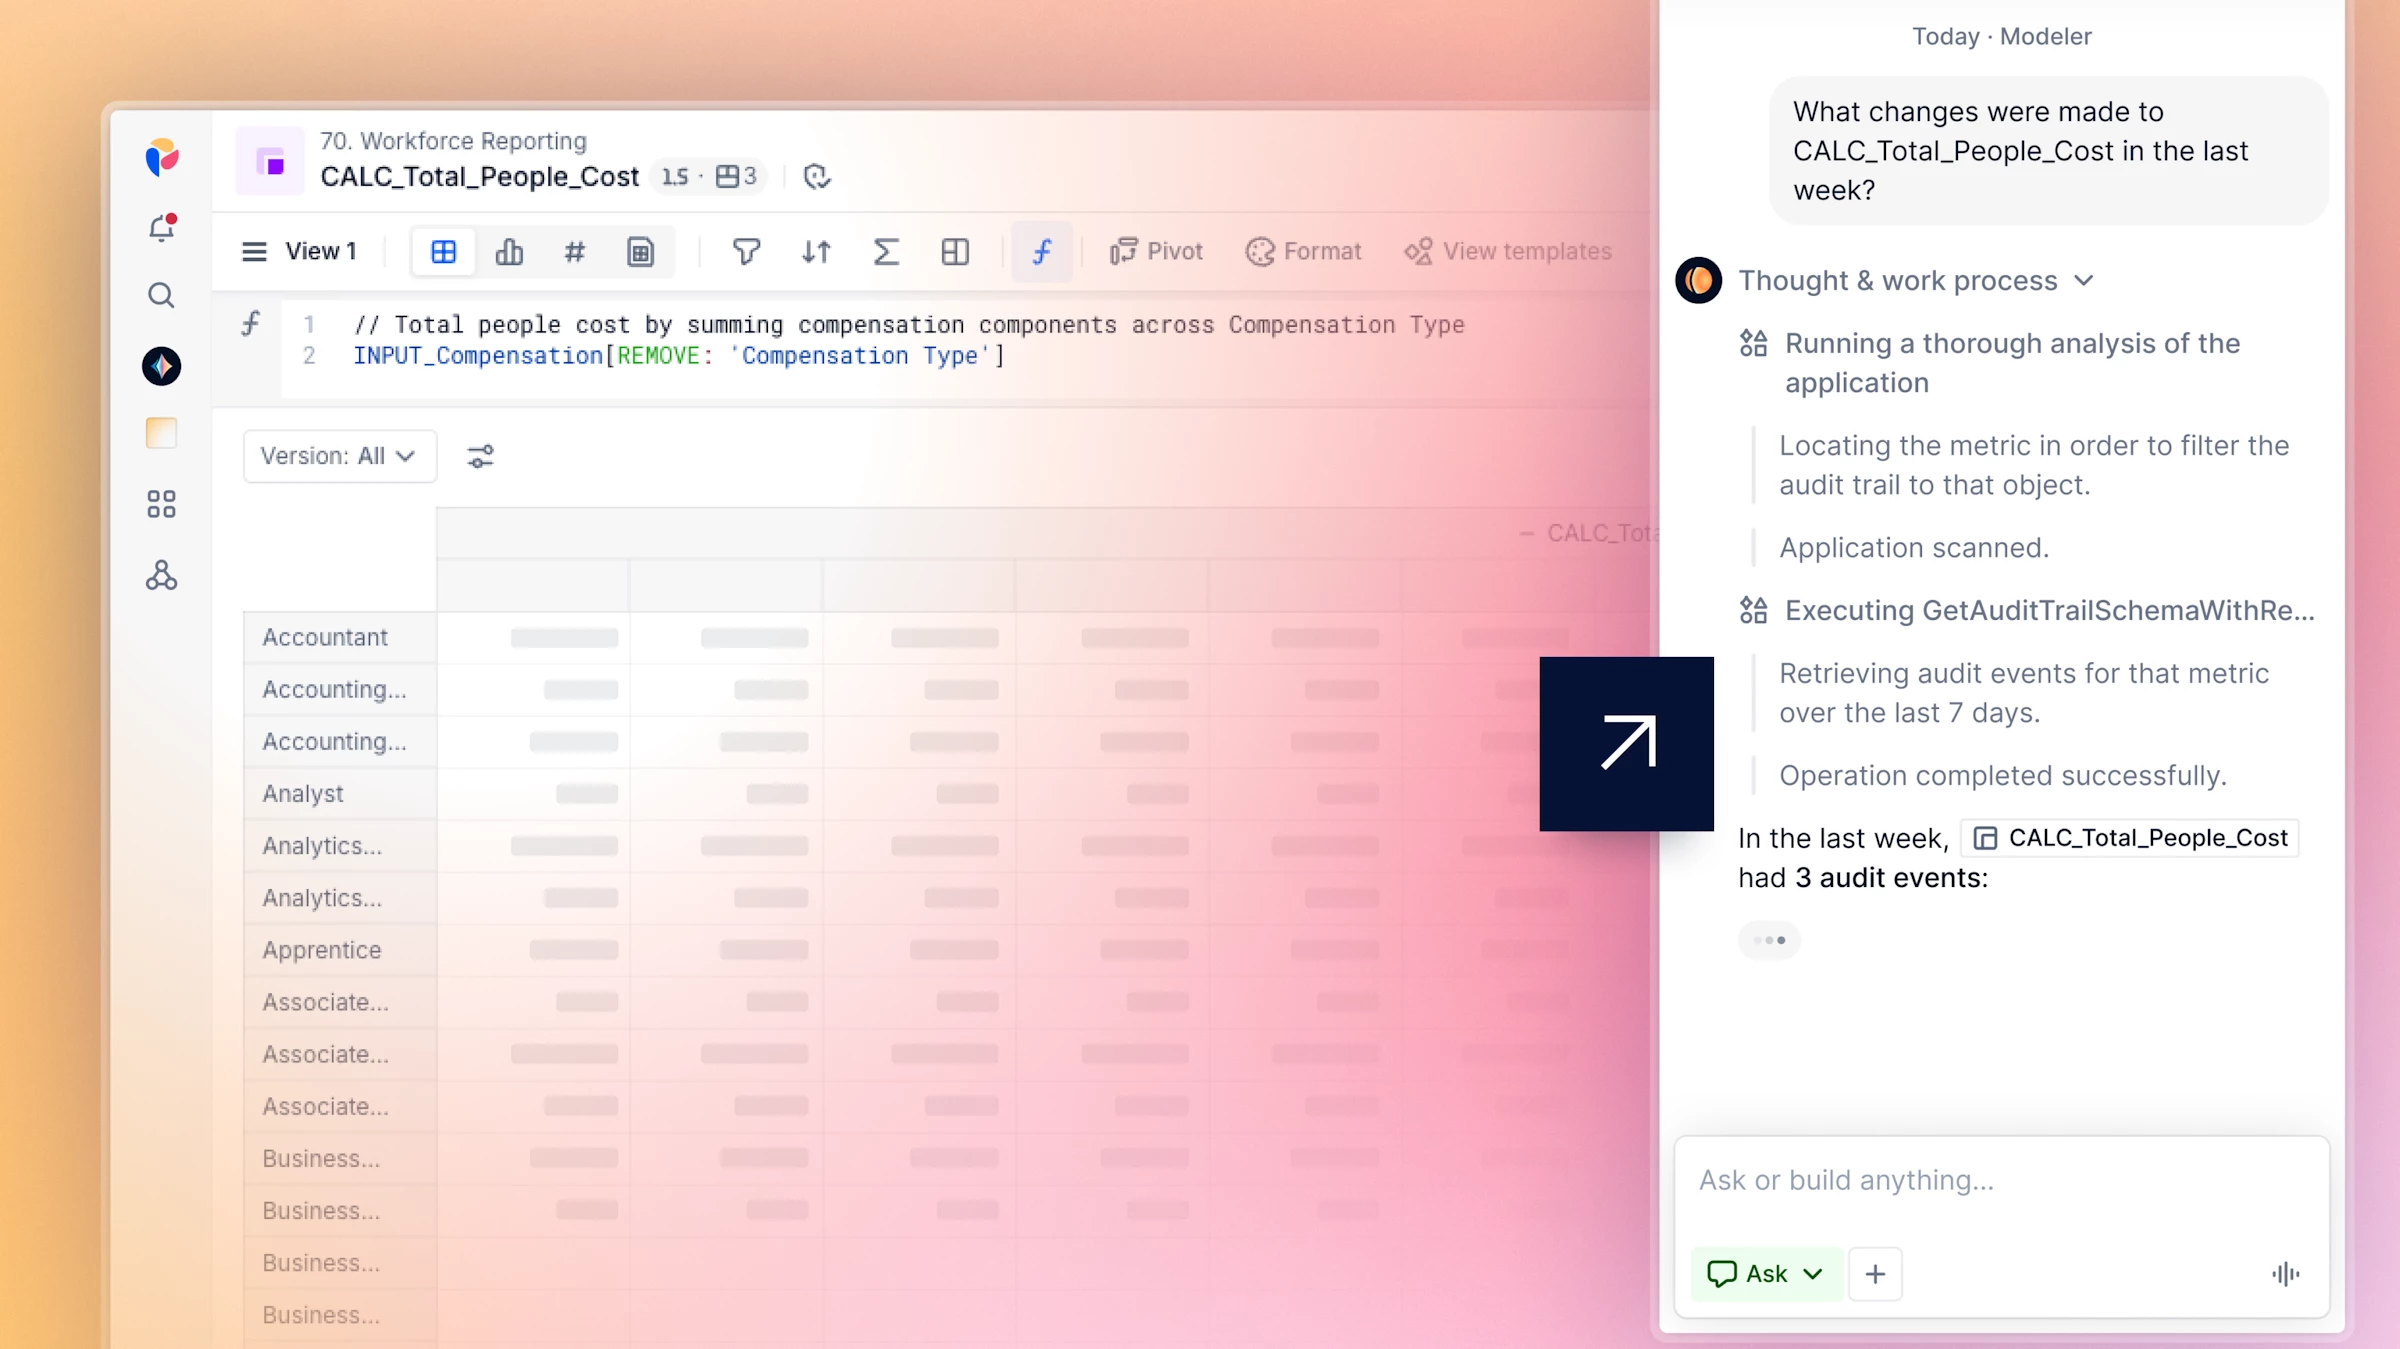
The Modeler Agent can now review your Application history to help you quickly understand what changed and why. Ask questions about modeling updates, identify who changed an input, or investigate unexpected Board values without digging through logs.
Speed up your Modeler work
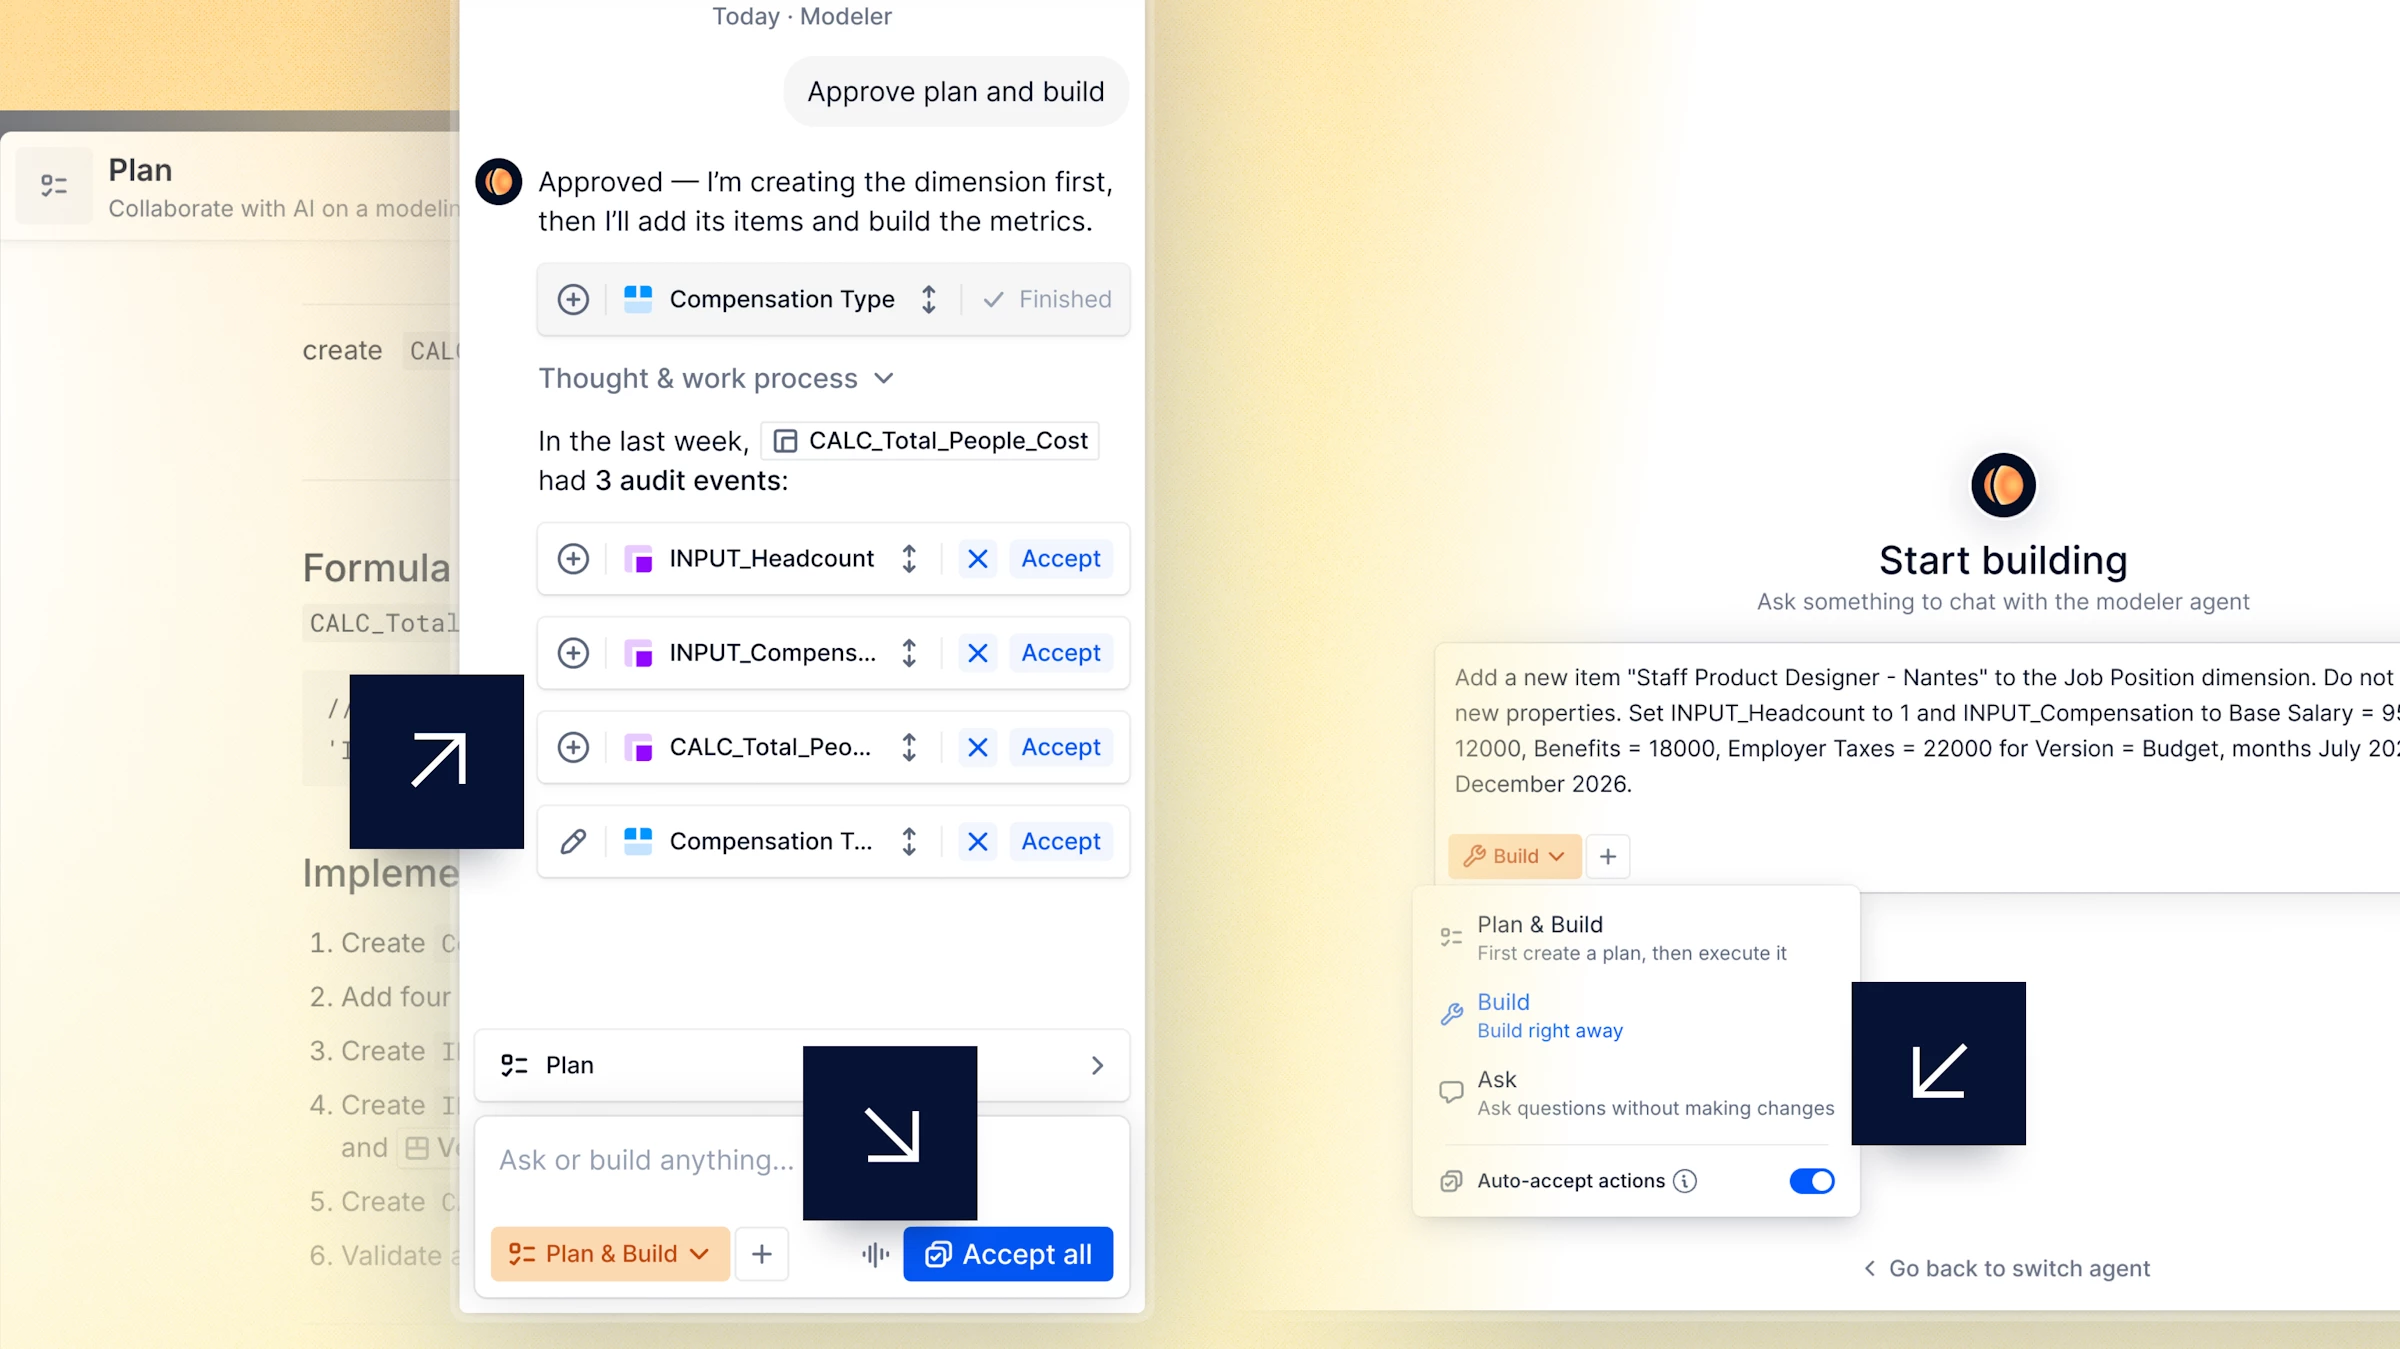
Speed up your Modeler workflows with two new interaction tools. Turn on Auto-accept actions to let the Modeler execute actions without approval prompts, or keep confirmations enabled and use the new Accept all button to approve multiple actions with fewer clicks.
Color charts by Dimension Items
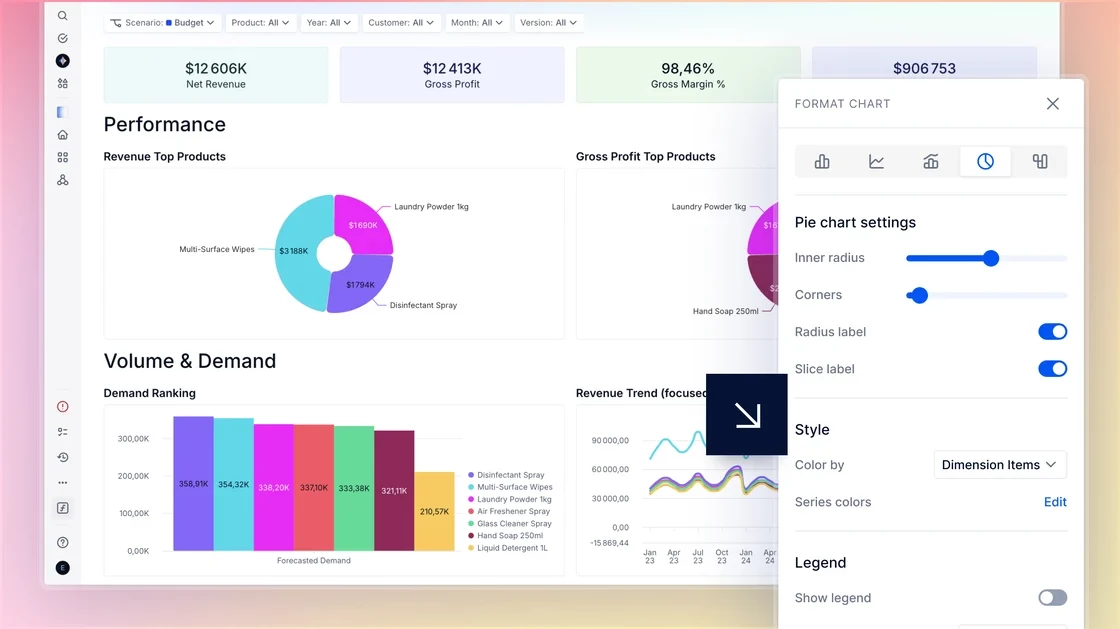
You can now apply colors defined on Dimension Items directly to your charts for more consistent Board styling. Select Dimension Items from the chart’s Color by settings to automatically apply model-defined colors across Bar, Line, Pie, and Combined charts.
Hierarchy View Templates
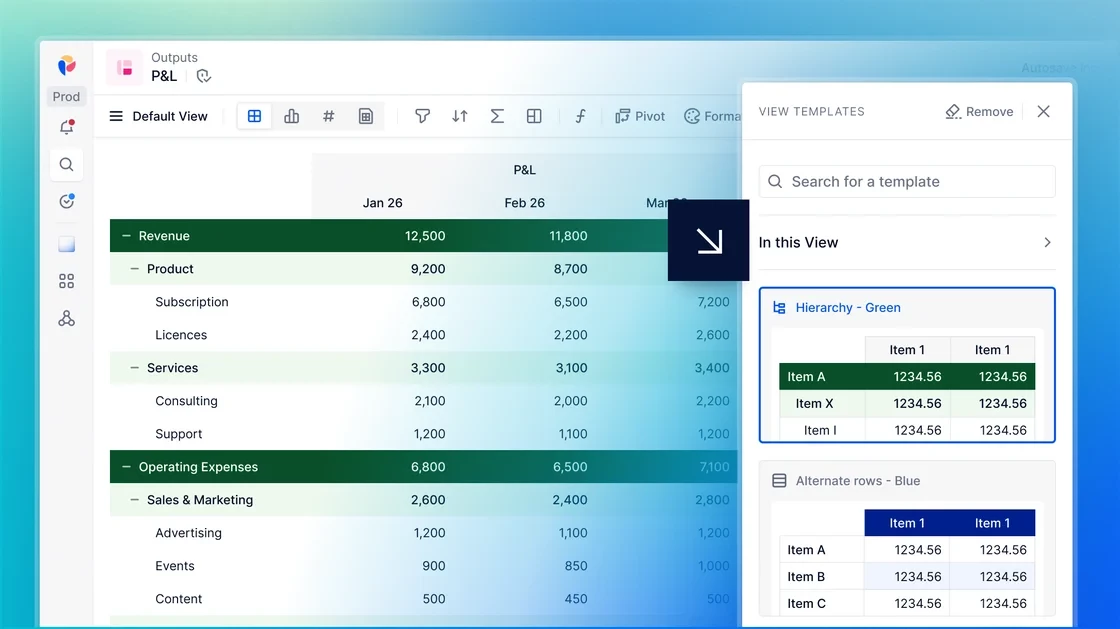
Format complex Views more easily with Hierarchy View Templates. Apply custom styles to up to five hierarchy levels, adjust cell styles and secondary headers, and reuse templates across Views to keep financial reports and organisational structures consistent and easy to navigate.
Chart Updates: Line, Combined, Pie & Waterfall Charts!
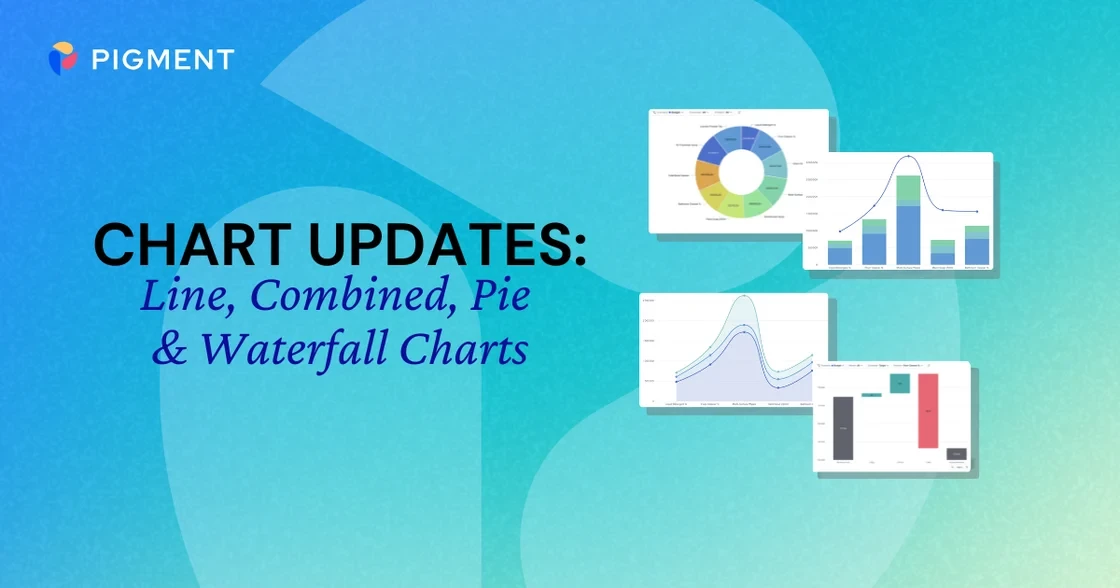
We’ve made Waterfall charts easier to read with improved X-axis labels and clearer grid lines coming the first week of June! We’ve also improved chart interactions across Line, Combined, Pie charts with easier tooltip hovering, scrollable legends for complex views, and left-aligned color markers to help you follow chart series more quickly.
Pigment Virtual User Group
Our next Virtual User Group allows you to connect with peers and the Pigment team to discuss crucial planning topics rather than sitting through a traditional webinar. Participants can choose between three tailored discussion tracks covering Pigment AI implementation, change management for better adoption, or essential workspace administration and security. The session concludes with a preview of upcoming community news, future webinars, and certification programs.
Register here - June 18th
Meet the minds behind the numbers

Hear your fellow planners and meet the minds behind the numbers. Pigment Portraits is a podcast series that opens the door to how high-performing organizations build plans, make decisions, and adapt in moments that matter.
Pooja Agrawal (Docker), Sophia Fatakhova (Chime) and Sara Park (The Coca-Cola Company) have already shared their professional journey and biggest accomplishments - so check your favorite podcast platform and apply to be our next champion. We will be thrilled to frame your portrait!
Apply here
Don’t miss it — check out this month’s LinkedIn Round-Up! ⬇
We're always looking to improve, so please don't be shy and share your comments via email, by contacting your Customer Success Manager, or here on our Community!!
All the best from everyone at Pigment.