


We are thrilled to announce a major step forward in how you visualize your data. We are progressively improving chart clarity and readability across our entire platform to ensure your insights are sharper than ever.
The Journey Begins with Bar Charts
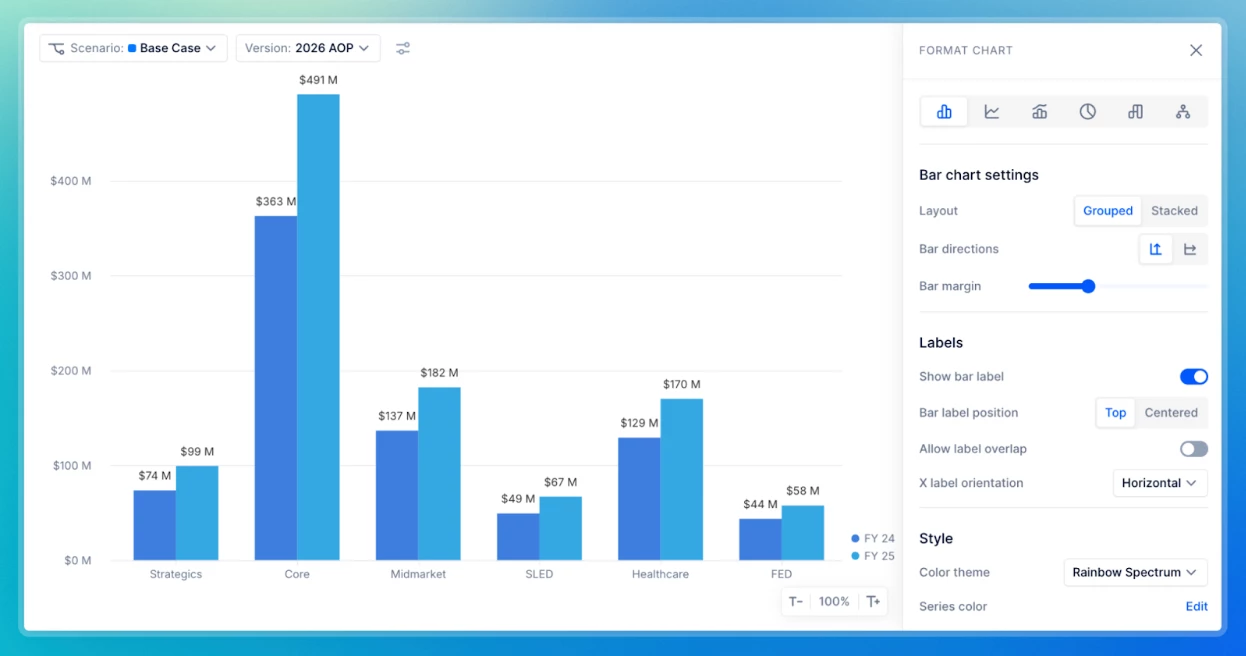
Starting in late January 2026, we are rolling out significant enhancements specifically for Bar charts. While your existing color palettes, layouts, and formatting will remain exactly as you like them, you will notice a cleaner, more intuitive feel to your visualizations.
What’s Changing?
We’ve focused on three core areas to improve your experience:
- Improved Readability: Labels and legends are now clearer with cleaner spacing. Grid lines have been added to appear between bars, making data much easier to digest at a glance.
- Optimized Layouts: We’ve redesigned the widget layout to give the charts themselves more room, maximizing the visibility of your data.
- Richer Interactions:
- Scrollable Legends: No more lost information! Legends containing long lists are now scrollable, ensuring every item remains accessible.
- Left-Aligned Color Markers: To make identifying series easier, color markers now appear to the left of each label rather than above them.
For a full visual walkthrough of these updates, you can download our detailed PDF guide below to see side-by-side comparisons of the changes.
Want Early Access?
While these changes will go live for everyone at the end of January, you don't have to wait! If you are excited to try these improvements today, you can reach out to our Support team to opt-in early. Our team is also standing by to help if you notice any unexpected visual changes in your Workspace during this transition.
Looking Ahead
This is just the first step. In the coming months, we will be rolling out similar improvements to Line charts, Combined charts, Pie charts, and more. Our goal is to support even more advanced chart types and interactions in the future without disrupting your current Boards.
Stay tuned for more updates as we continue to make your data work harder for you!