

The Insights feature provides automated, AI-powered data variance and contribution analysis. It identifies the Dimensions and Properties driving changes in your KPIs and Metrics, providing visualizations and written explanations to enhance decision-making.
How Insights can help you
Here are three use cases Insights can help with.
Use Case 1: Variance Analysis
Teams frequently need to understand why performance has changed over time or across different versions. Instead of manually filtering through reports and pivot tables, Insights automatically identifies the top contributors of variances—whether it’s a shift in revenue, costs, or headcount. This helps Members quickly spot trends and make data-driven decisions.
Variance analysis can be applied across different timeframes and versions. Examples include:
- Period-over-Period Analysis: Identify trends by comparing Month-over-Month (MoM), Quarter-over-Quarter (QoQ), or Year-over-Year (YoY) performance.
- Version Comparisons: Track deviations between Actuals vs. Budget, Actuals vs. Forecast, or Forecast vs. Forecast.
Typically, Members can find the following from Insights:
- Revenue: A sudden decline in total revenue needs further analysis. Insights helps users break down revenue shifts by region, industry, or customer type to pinpoint whether specific countries or segments are underperforming.
- Cost: A significant increase in operational expenses requires investigation. Insights identifies changes in fixed vs. variable costs and detects whether increases stem from new vendors, increased service costs, or unexpected spikes in specific expense categories.
- Gross Margin / Profit: If gross margin is fluctuating, users need to understand the root cause. Insights breaks down profitability by product category, helping to identify areas where margins are compressing.
- Headcount and Compensation: If salary costs are misaligned with budget expectations, Insights can highlight which departments are contributing to the variance—whether due to delayed hiring, structural salary adjustments, or workforce reductions.
- Marketing and Advertising Spend: A sharp rise in marketing expenses warrants closer examination. Insights enables users to analyze which campaigns, regions, or channels are driving the variance.
Use Case 2: Drill-down analysis
When analyzing high-level Metrics in an aggregated report, Members often need to identify the key drivers behind a change. With Insights, instead of having to manually select a specific Dimension to drill into, Members receive a breakdown of the most relevant Dimensions and top contributing factors. Insights removes the need to guess which breakdown to explore. Examples include:
- A finance team is reviewing total revenue at a regional level and needs to see which countries or segments contributed the most to an increase or decline.
- An operations team notices an unexpected increase in total expenses and wants to uncover whether it is driven by specific vendors, cost centers, or other dimensions.
- A product team is examining gross margin shifts and wants to identify which product categories or business lines had the biggest impact.
Use Case 3: Data Validation
When importing or transforming data, Insights checks for consistency, highlighting unexpected deviations. For example:
- Load validation: When loading new data, unexpected deviations in key business metrics can go unnoticed, leading to incorrect decisions. Insights helps automatically detect anomalies, such as missing vendors, significant discrepancies between periods, duplicate transactions, or unexplained spikes.
- Transformation validation: If data transformations are applied across many Metrics, verifying the accuracy of the calculations can be time-consuming. Insights can automate the process of detecting inconsistencies by comparing initial, intermediate, and final Metric values.
Before you begin
Metrics’ AI set-up
Workspace Administrators need to set up the following for Insights. If you have already set this up for the Data Assistant, you can skip to the next section:
- AI activation. Ensure AI has been activated as set out here.
- Enable Metrics for AI. See this article for selection tips and guidance.
- Configure AI Metrics and Dimensions. Optimize the below using the guidance in the links:
- Default formatting for Metrics
- Default aggregation for Metrics
- Default Single Selection for Dimensions
ℹ️ Note
By default, when you choose single selection, the first Item in the Dimension List is the selected Item.
Prepare your Boards for Insights
Members can get Insights from Boards’ KPIs. To set this up, choose KPIs that:
- originate from AI-enabled Metrics
- measure either variance or contribution
The below table gives information on these two analysis types:
Analysis type Description Type of Views Supported Sample prompt Variance Explains factors driving variance (e.g. actuals vs. budget, current vs. previous year) Two cells “Compare revenue year 23 to year 24” Contribution Drills down into Items driving the KPI One cell “What was my revenue last quarter"
Customize Insights results
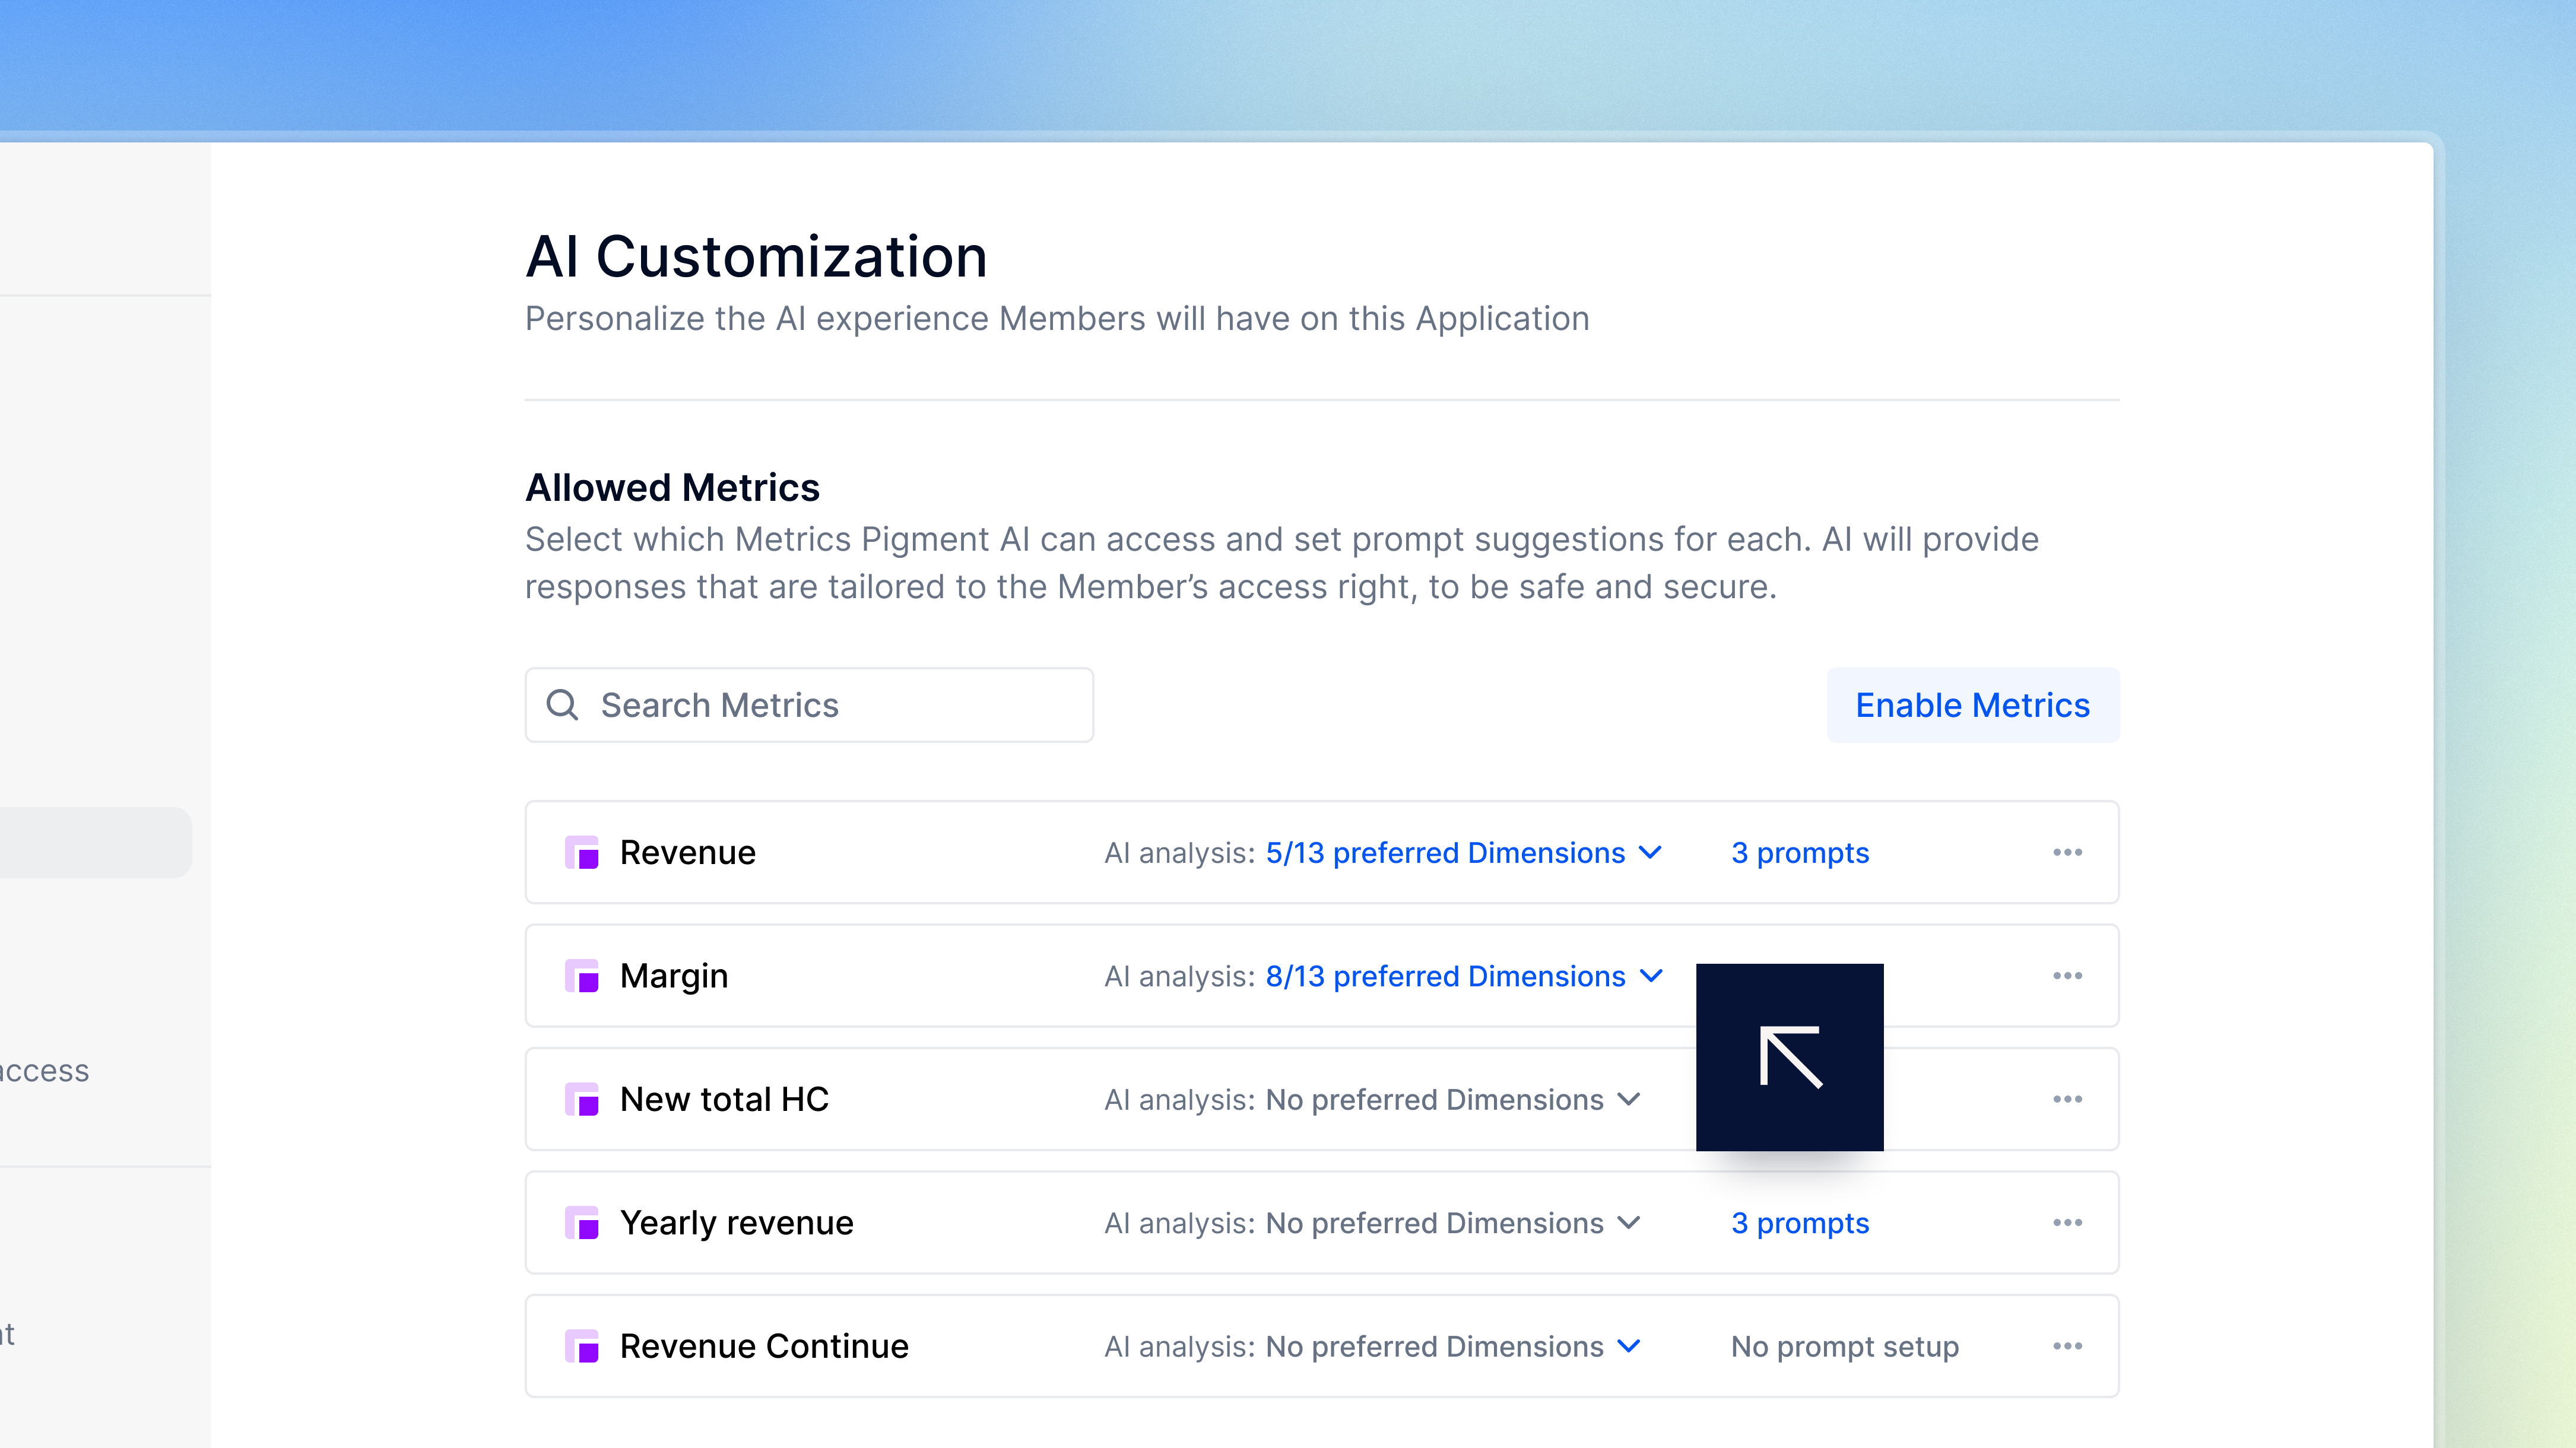
You can fine-tune Insights results by defining key business-critical Dimensions:
- In your Application, select the three dots at the bottom of the sidebar and then AI Customization.
- In Allowed Metrics, open the AI analysis dropdowns by the relevant Metrics (see image below).
- Select your preferred Dimensions.
Grant the AI analysis permission
Members need the AI analysis permission to use Insights. See this article for more information.
Access rights
The Insights feature only provides responses that the Member has the right to see.
For example, if a Member with access to a single country selects Get Insights, it returns Insights just for that specific country.
You can define Members’ access rights from the Roles, permissions and access page. See this article for more information.
How to use Insights
There are two ways to access Insights:
From the Data Assistant
- Ask the Data Assistant a question related to a Metric.
- Below the response, select Get Insights.
Insights results appear as visualizations and written explanations.
From a Board (AI-enabled Metrics only)
- Open a Board containing an AI-enabled Metric.
- Insights is available in two places:
- Views: hover over a View that uses the AI-enabled Metric. The blue AI icon appears, labelled with the Get Insights tooltip (not available for Tables).
- Tables: right-select a cell in a Table added as a Grid. A menu opens including Get Insights.
- Select Get Insights. The Data Assistant opens, as above.
Follow-up analysis
After Insights generates initial results, you can:
- Continue the analysis:
- Either select a Suggested next step
- Or type directly in the input bar to explore further. You can broaden or narrow the scope
- Quit the workflow:
- To switch analysis type, select the X next to Get insights (tooltip: Quit workflow)
- This returns you to the Data Assistant
- Exit AI:
- To fully leave AI, select the X with the tooltip Close
- This exits Insights and returns you to the platform
⚠️ Important
Within an Insights conversation, you cannot switch between analysis types.
- If you start with a contribution analysis, you cannot ask for a variance analysis as a follow-up.
- If you start with a variance analysis, you cannot ask for a contribution analysis as a follow-up.
Limitations
The following table sets out Insights’ limitations:
| Limitation | Detail |
|---|---|
| KPI trendlines handling | Insights analyzes the full trend rather than just the latest value. |
| Data aggregation in Summaries | In some cases, cumulative metrics may be incorrectly aggregated, even if default aggregation settings are correct. If you notice inconsistencies, take a screenshot and submit a Support ticket. |
| Single Metric support only | Multiple Metric Insights and Tables are not supported yet. |
| Multiple Scenarios | Comparison of more than two Scenarios is not supported. |
| Snapshots | AI doesn't have access yet to Snapshots data. |
| Calculated Items, Show Value As (SVAs), and Totals | Insights triggered from Calculated Items, Show Value As (SVAs), and Totals are occasionally inaccurate at present—this is being resolved. |
🎓 Pigment Academy
For detailed insights, examples and use cases on Pigment’s AI tools, explore the Pigment AI Learning Path.