Hi Alina,
Great question!
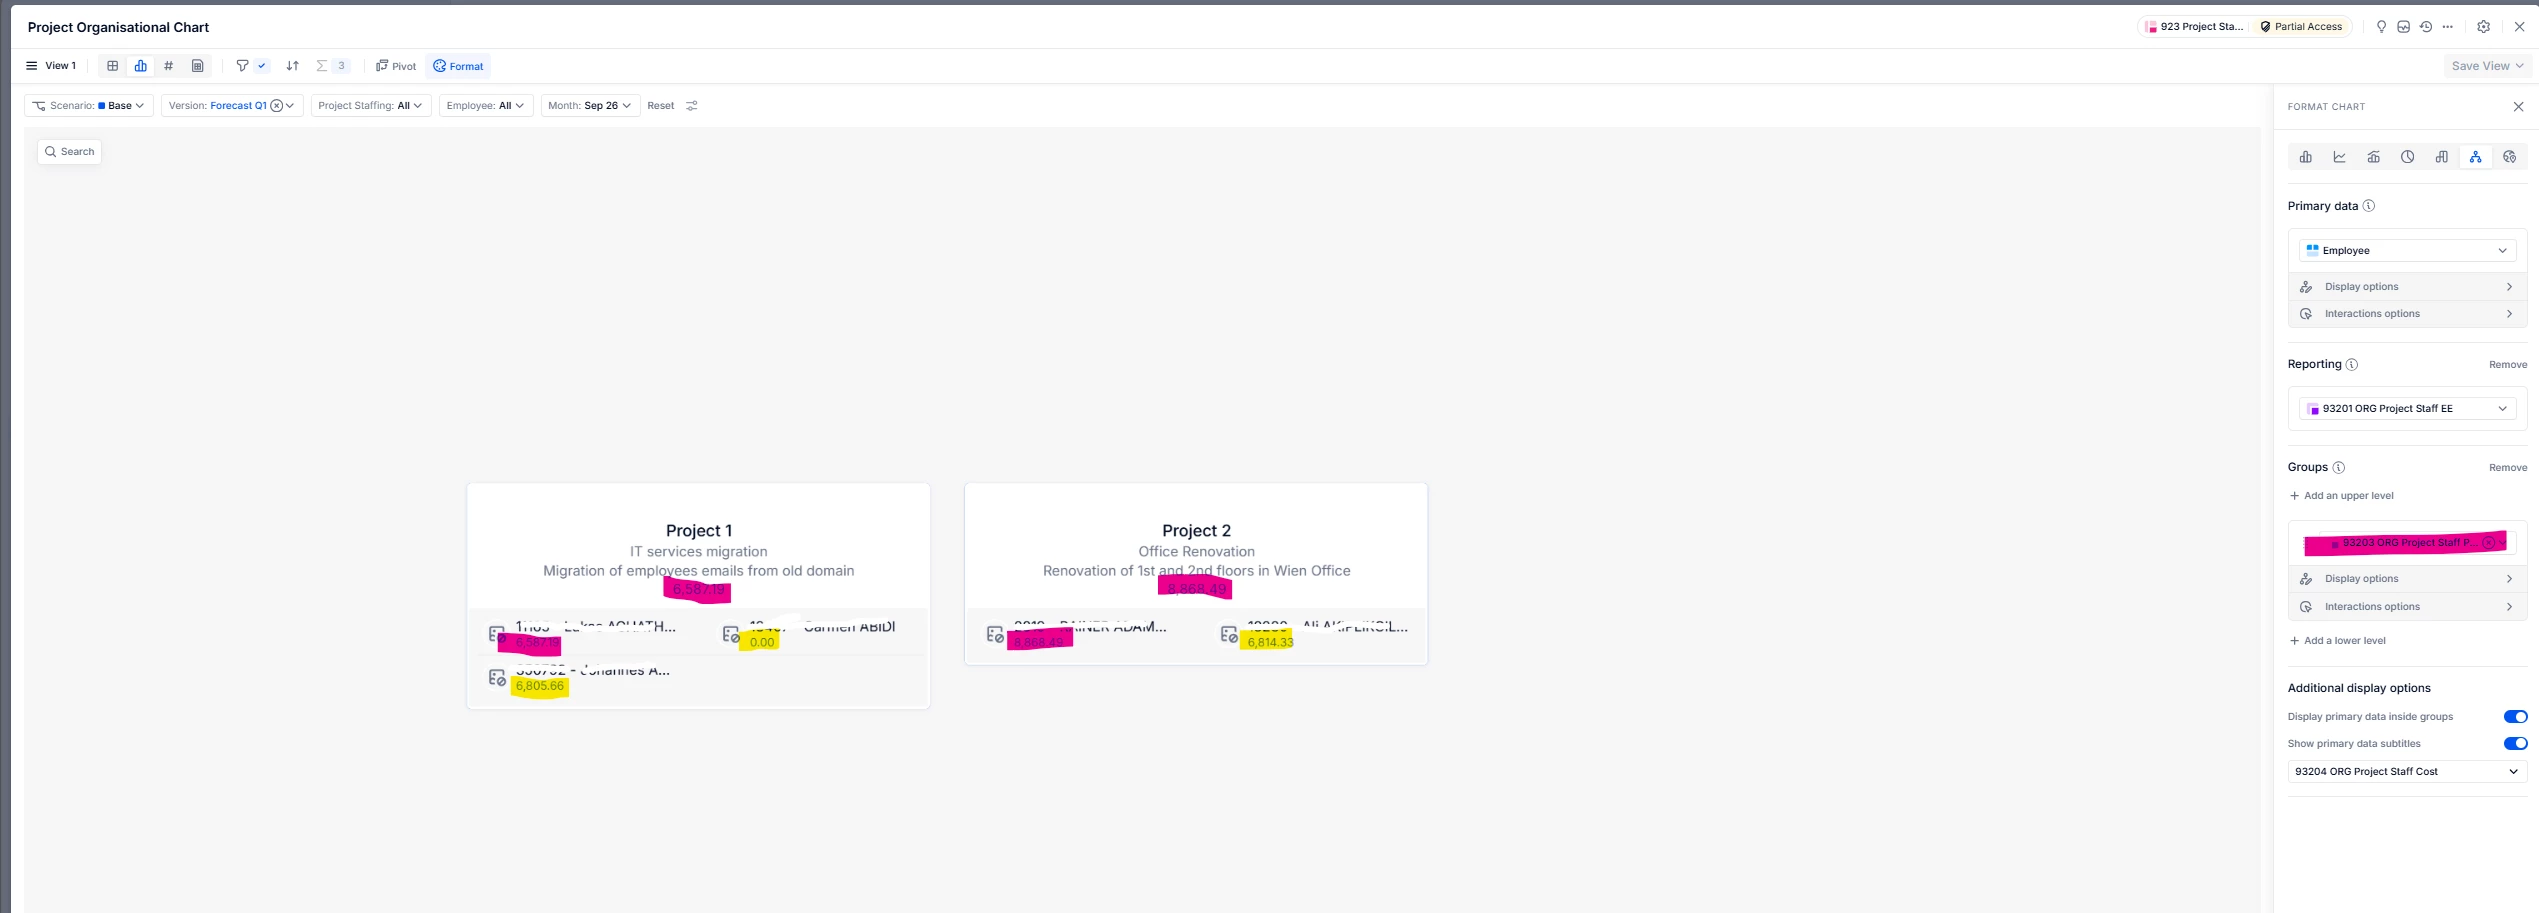
At the moment, the Org Chart doesn’t support selecting the aggregation method (e.g., SUM) for values displayed at a grouped level. When multiple employees sit under the same Project node, the Org Chart displays a representative value (First non-blank), which is why you don’t see the summed project cost there, even though the grid view totals are correct.
A reliable workaround is to create a helper metric that calculates the project's total cost and “broadcasts” that total to each employee on the project. The Org Chart will then show the correct project total because every underlying row carries the same value.
Example patterns:
1. If Project is a dimension: ‘Cost’[BY SUM: Project][BY CONSTANT: Project]
2. If Project is a property on Employee: ‘Cost’[BY SUM: Employee.Project][BY CONSTANT: Employee.Project]
Then, in the Org Chart settings, select this helper metric as the subtitle/value to display.
We hope this helps :)
Best,
Tobias