

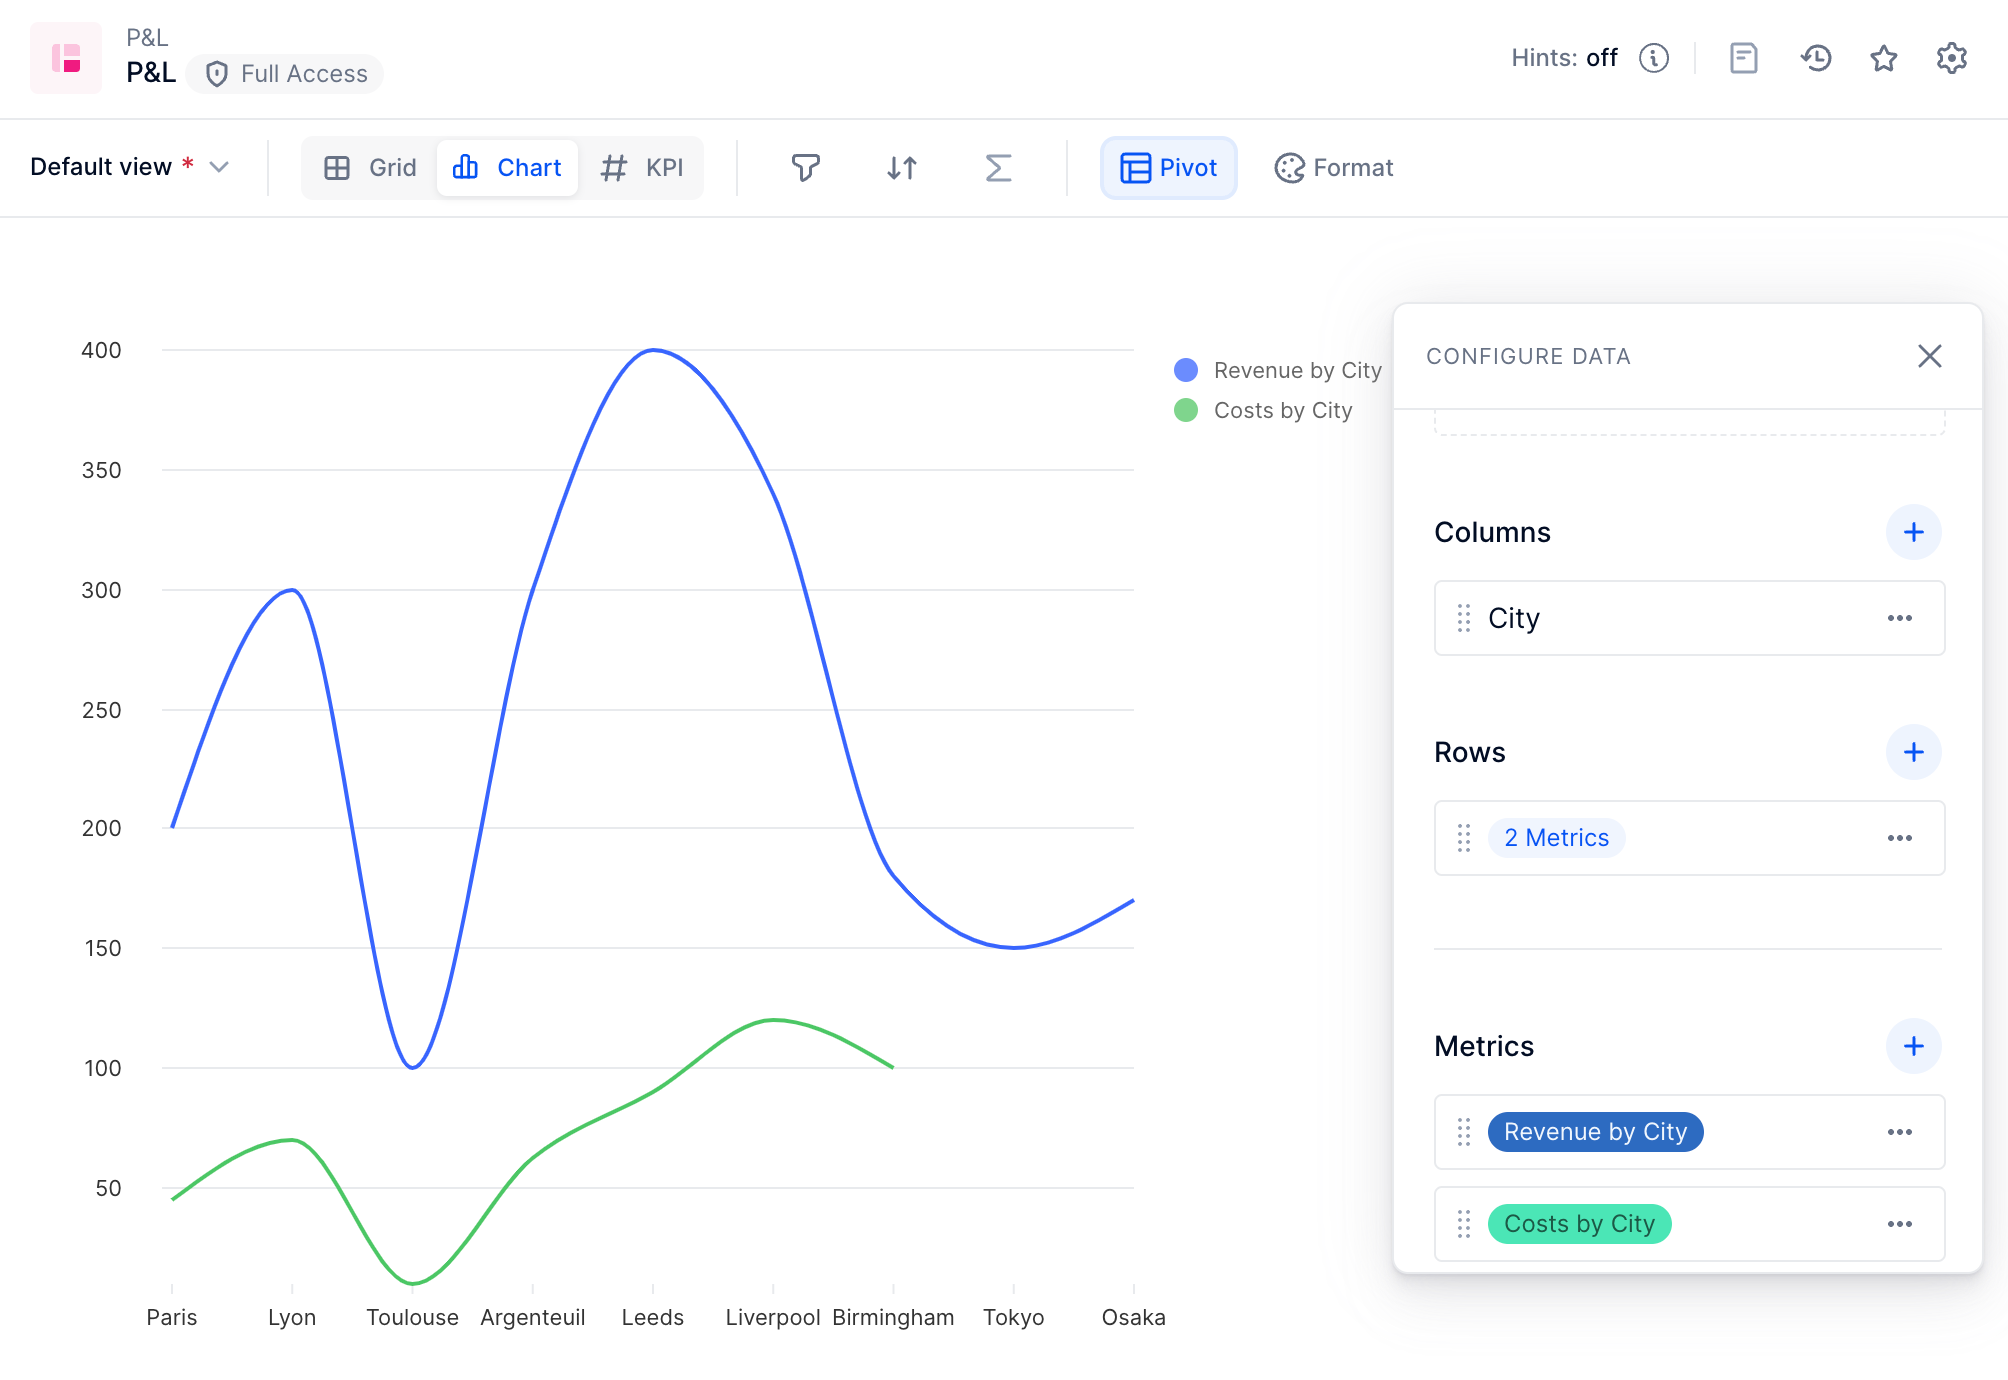
Can we create charts for Tables with different Metrics as Series of the chart?


Enter your E-mail address. We'll send you an e-mail with instructions to reset your password.
Enter your E-mail address. We'll send you an e-mail with instructions to reset your password.