Question

Chart view doesn't allow for breakdown by

  • April 20, 2026
  • 1 reply
  • 18 views

Forum|alt.badge.img+2

Hello,

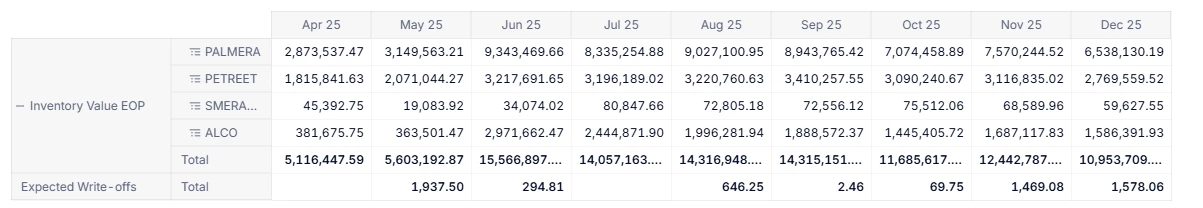
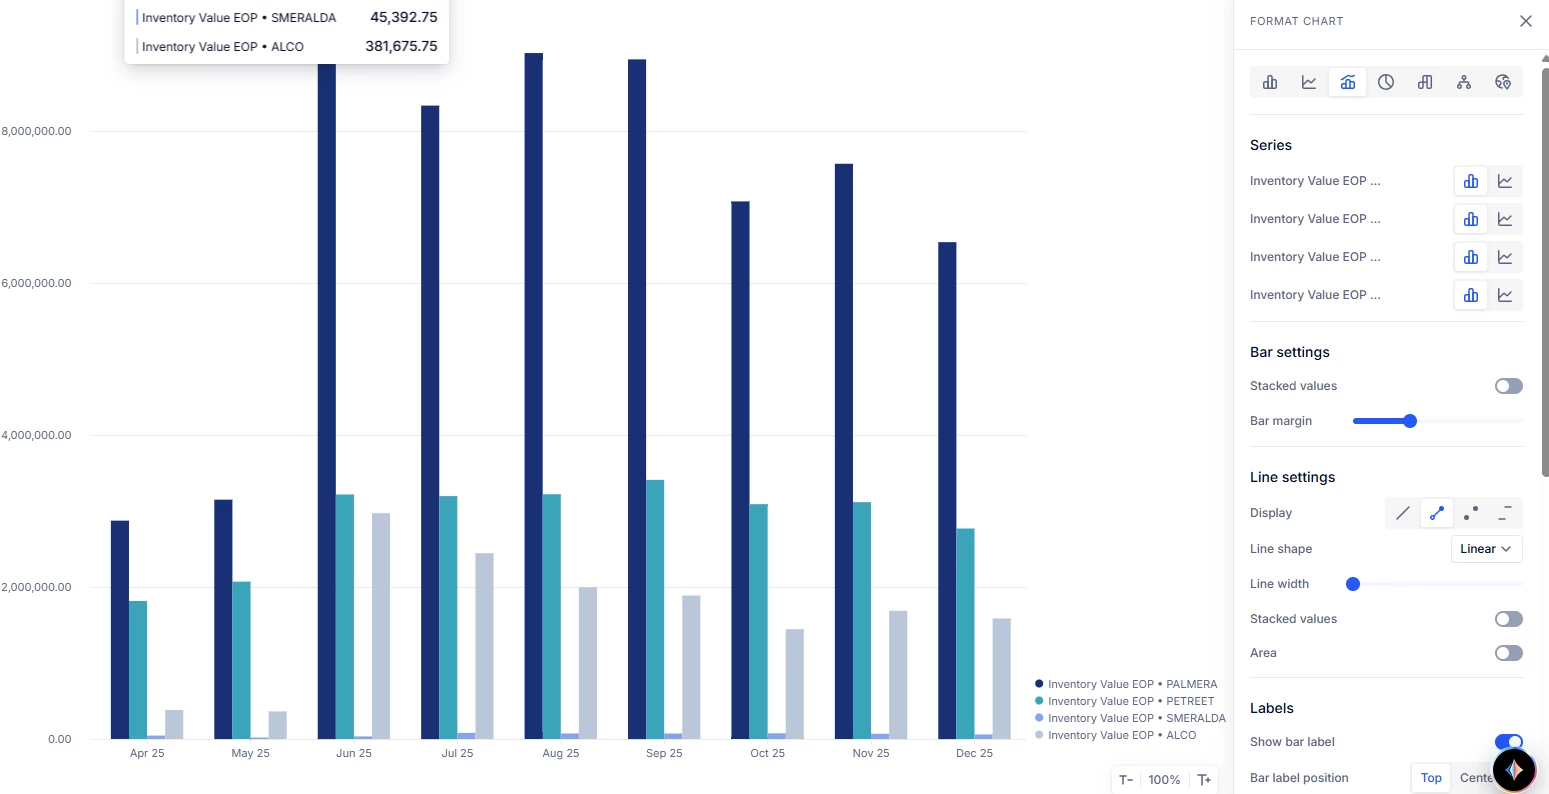
I have a grid with inventory value and expected write-downs by month, with inventory value broken down by month. This displays correctly in a grid view, but in a chart view the write-downs disappear. Is this a known issue and has anyone been able to solve this?


1 reply

Benoit
Community Manager
Forum|alt.badge.img+15
  • Community Manager
  • April 20, 2026

Hi William,


It seems your ‘Expected Write-offs’ line is an aggregated total, not broken down by ‘Inventory Value EOP’. So both metrics don’t share the same dimensionality.


In chart mode, Pigment looks at the dimensions in rows and columns, but does not render aggregated totals.


My recommendation would be to align the strucutre of your metrics so all the data could appear at the granular level, or stack bars to have the totals labels displayed.


Hope it helps. Please let us know.


Thanks