Hi,
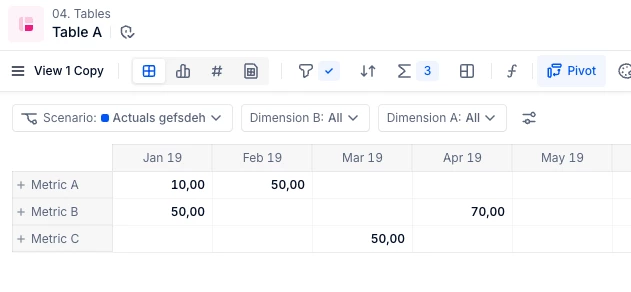
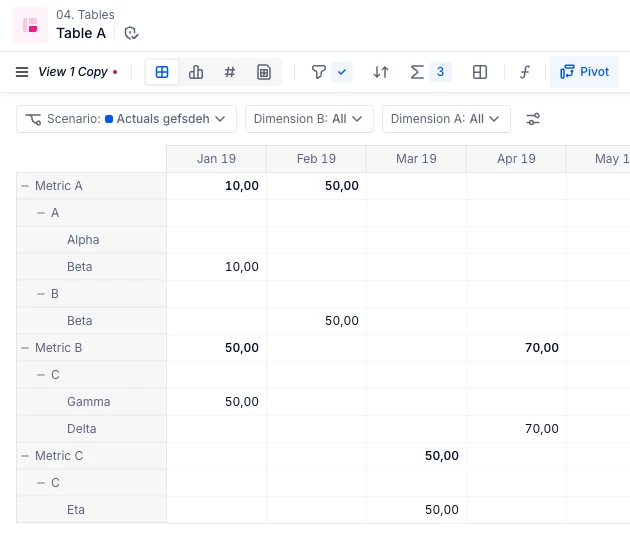
I would like to filter the metrics in a table so I have the option of only showing totals.
User would then toggle between the summary and detailed view via a button on a board.
How can it be done?




Hi,
I would like to filter the metrics in a table so I have the option of only showing totals.
User would then toggle between the summary and detailed view via a button on a board.
How can it be done?
Best answer by Gigi
Hi There!
In Pigment, you can’t “filter metrics to show only totals” within a single Table view, because totals are a display setting and they’re calculated from whatever metrics are included in that view (they aren’t a separate “totals-only” metric filter you can toggle).
Best practice workaround: create 2 saved Views + switch between them from the Board
This gives end users a clean “toggle” experience and is usually better for performance than trying to keep everything in one view and hiding/showing items.
You may find the link below to our Help Centre a useful resource.
https://kb.pigment.com/docs/customize-layout-views#display-mode
Enter your E-mail address. We'll send you an e-mail with instructions to reset your password.