Hi Tgilbert!
Thank you for the question.
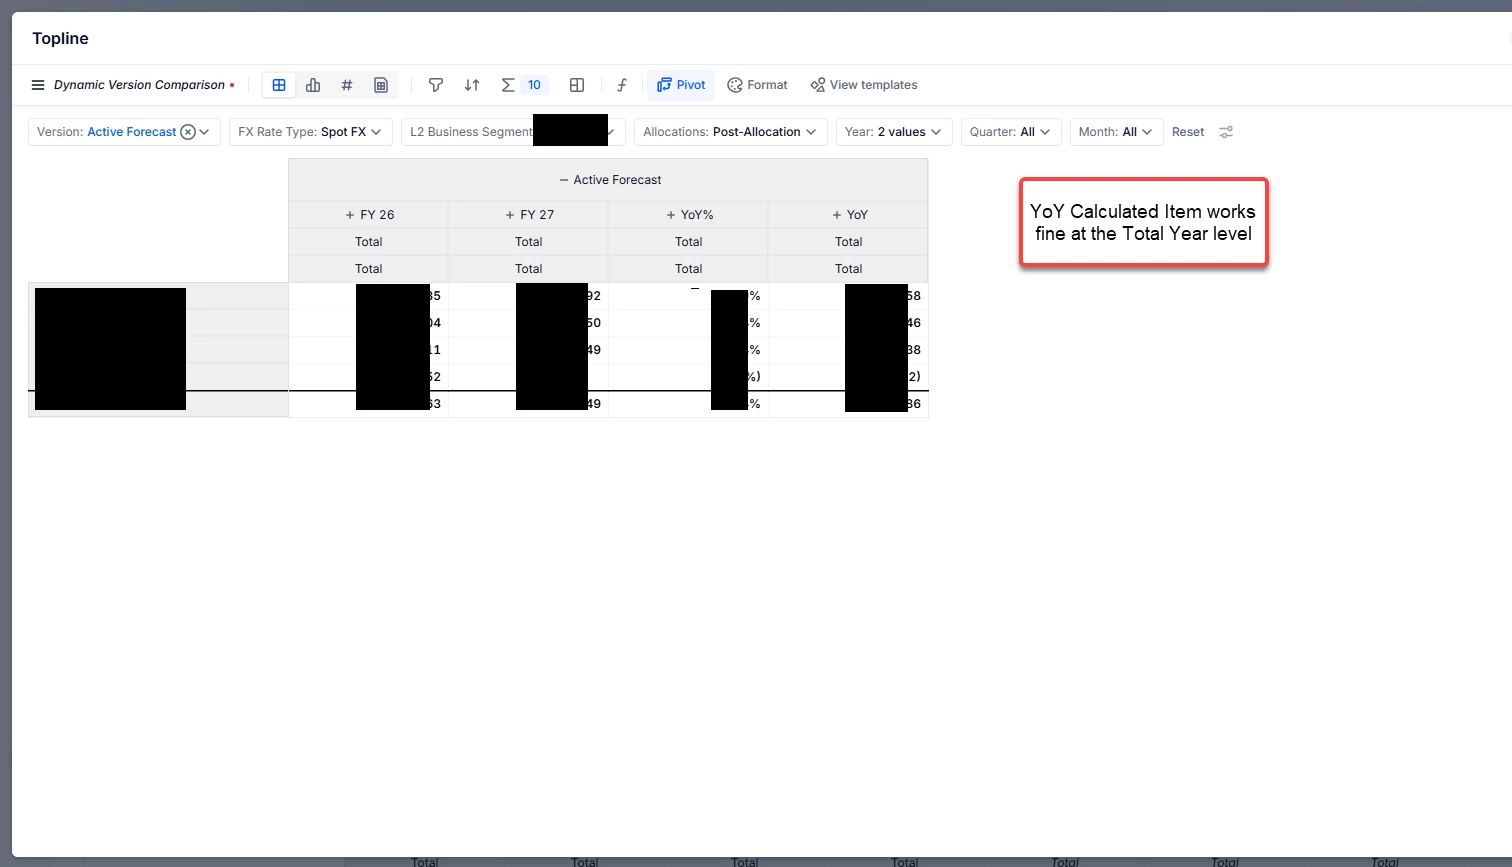
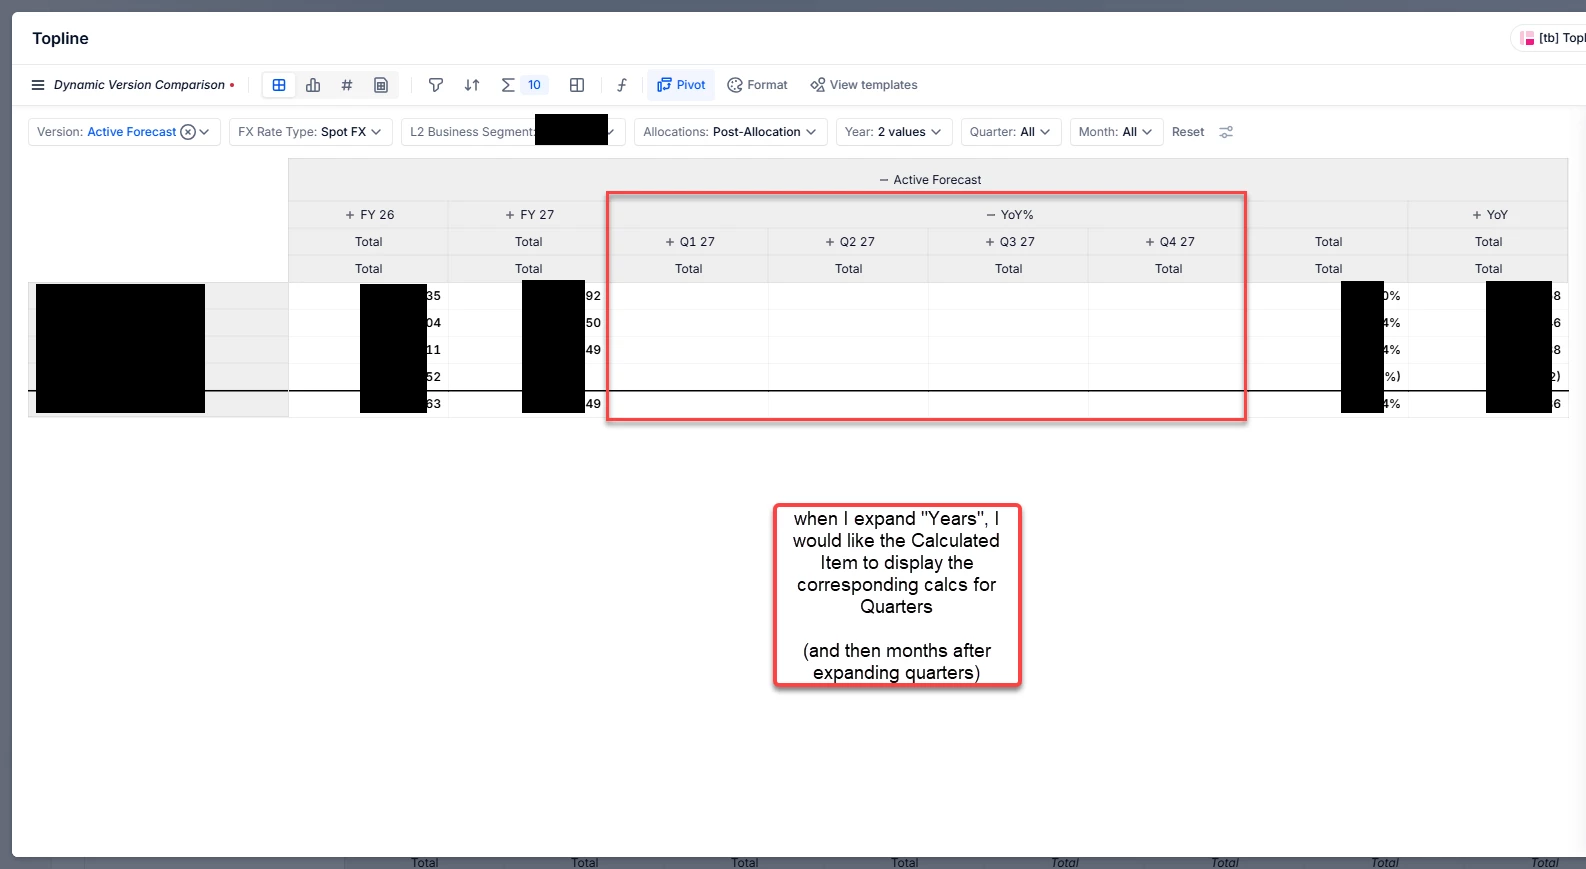
It may help to explain that analysis “Calculated Items” are display-level calculations. They often work at the current level you’re viewing (e.g.Year total) but don’t behave consistently when you expand a time hierarchy (Year > Quarter > Month).
Instead of a Calculated Item, build YoY as a model metric so it works at every time level automatically.
Start from your base metric
Example: Revenue (or any metric you want to compare year-over-year)
- Create a “Last Year” version of the metric
- Example: Revenue LY = Revenue shifted to the previous year
- (Use your model’s time-shift method for “previous year”.)
- Create YoY metrics
- YoY difference: YoY Δ = Revenue - Revenue LY
- YoY %: YoY % = (Revenue / Revenue LY) - 1
- (Add a safeguard if Revenue LY can be 0 or blank.)
- Use these metrics in your Analysis
- Put Revenue, Revenue LY, YoY Δ, and/or YoY % into the table.
Now when you expand Years > Quarters > Months, the YoY should stay consistent because it’s computed from the model, not the view.
I hope this helps!
Please check out the following articles which may be of use: