

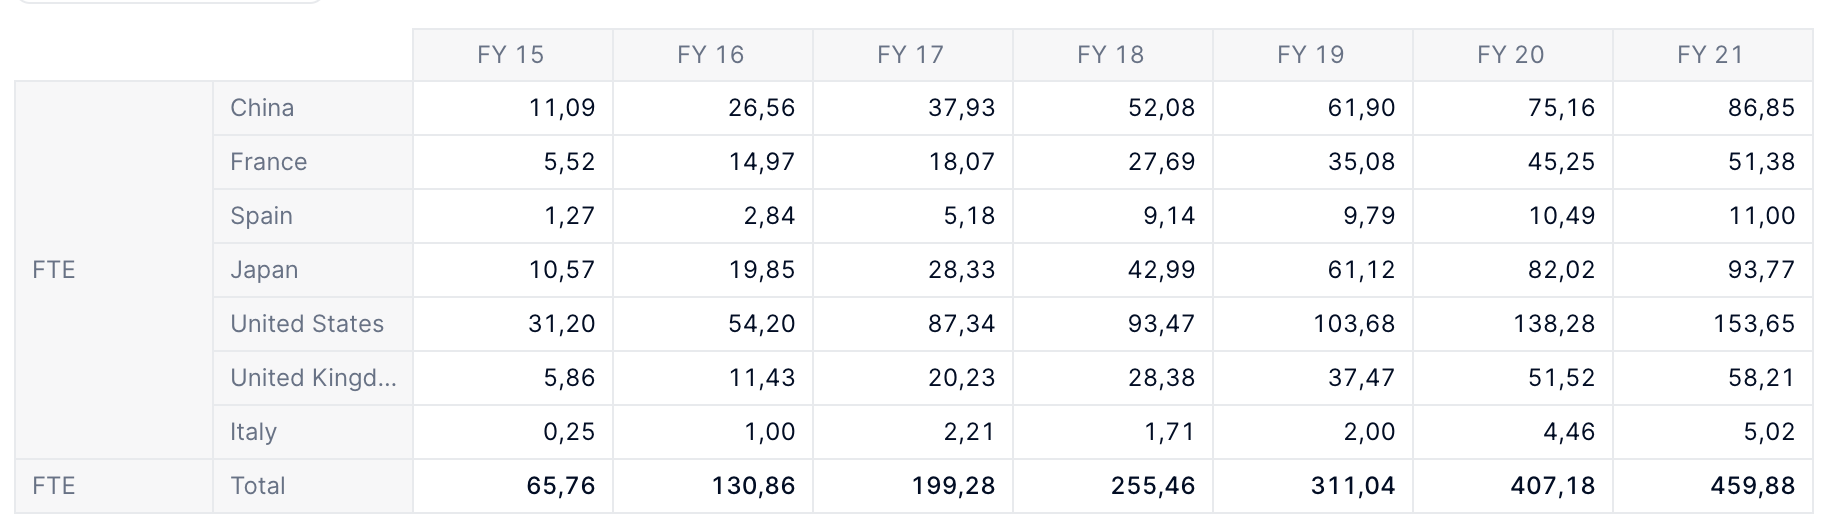
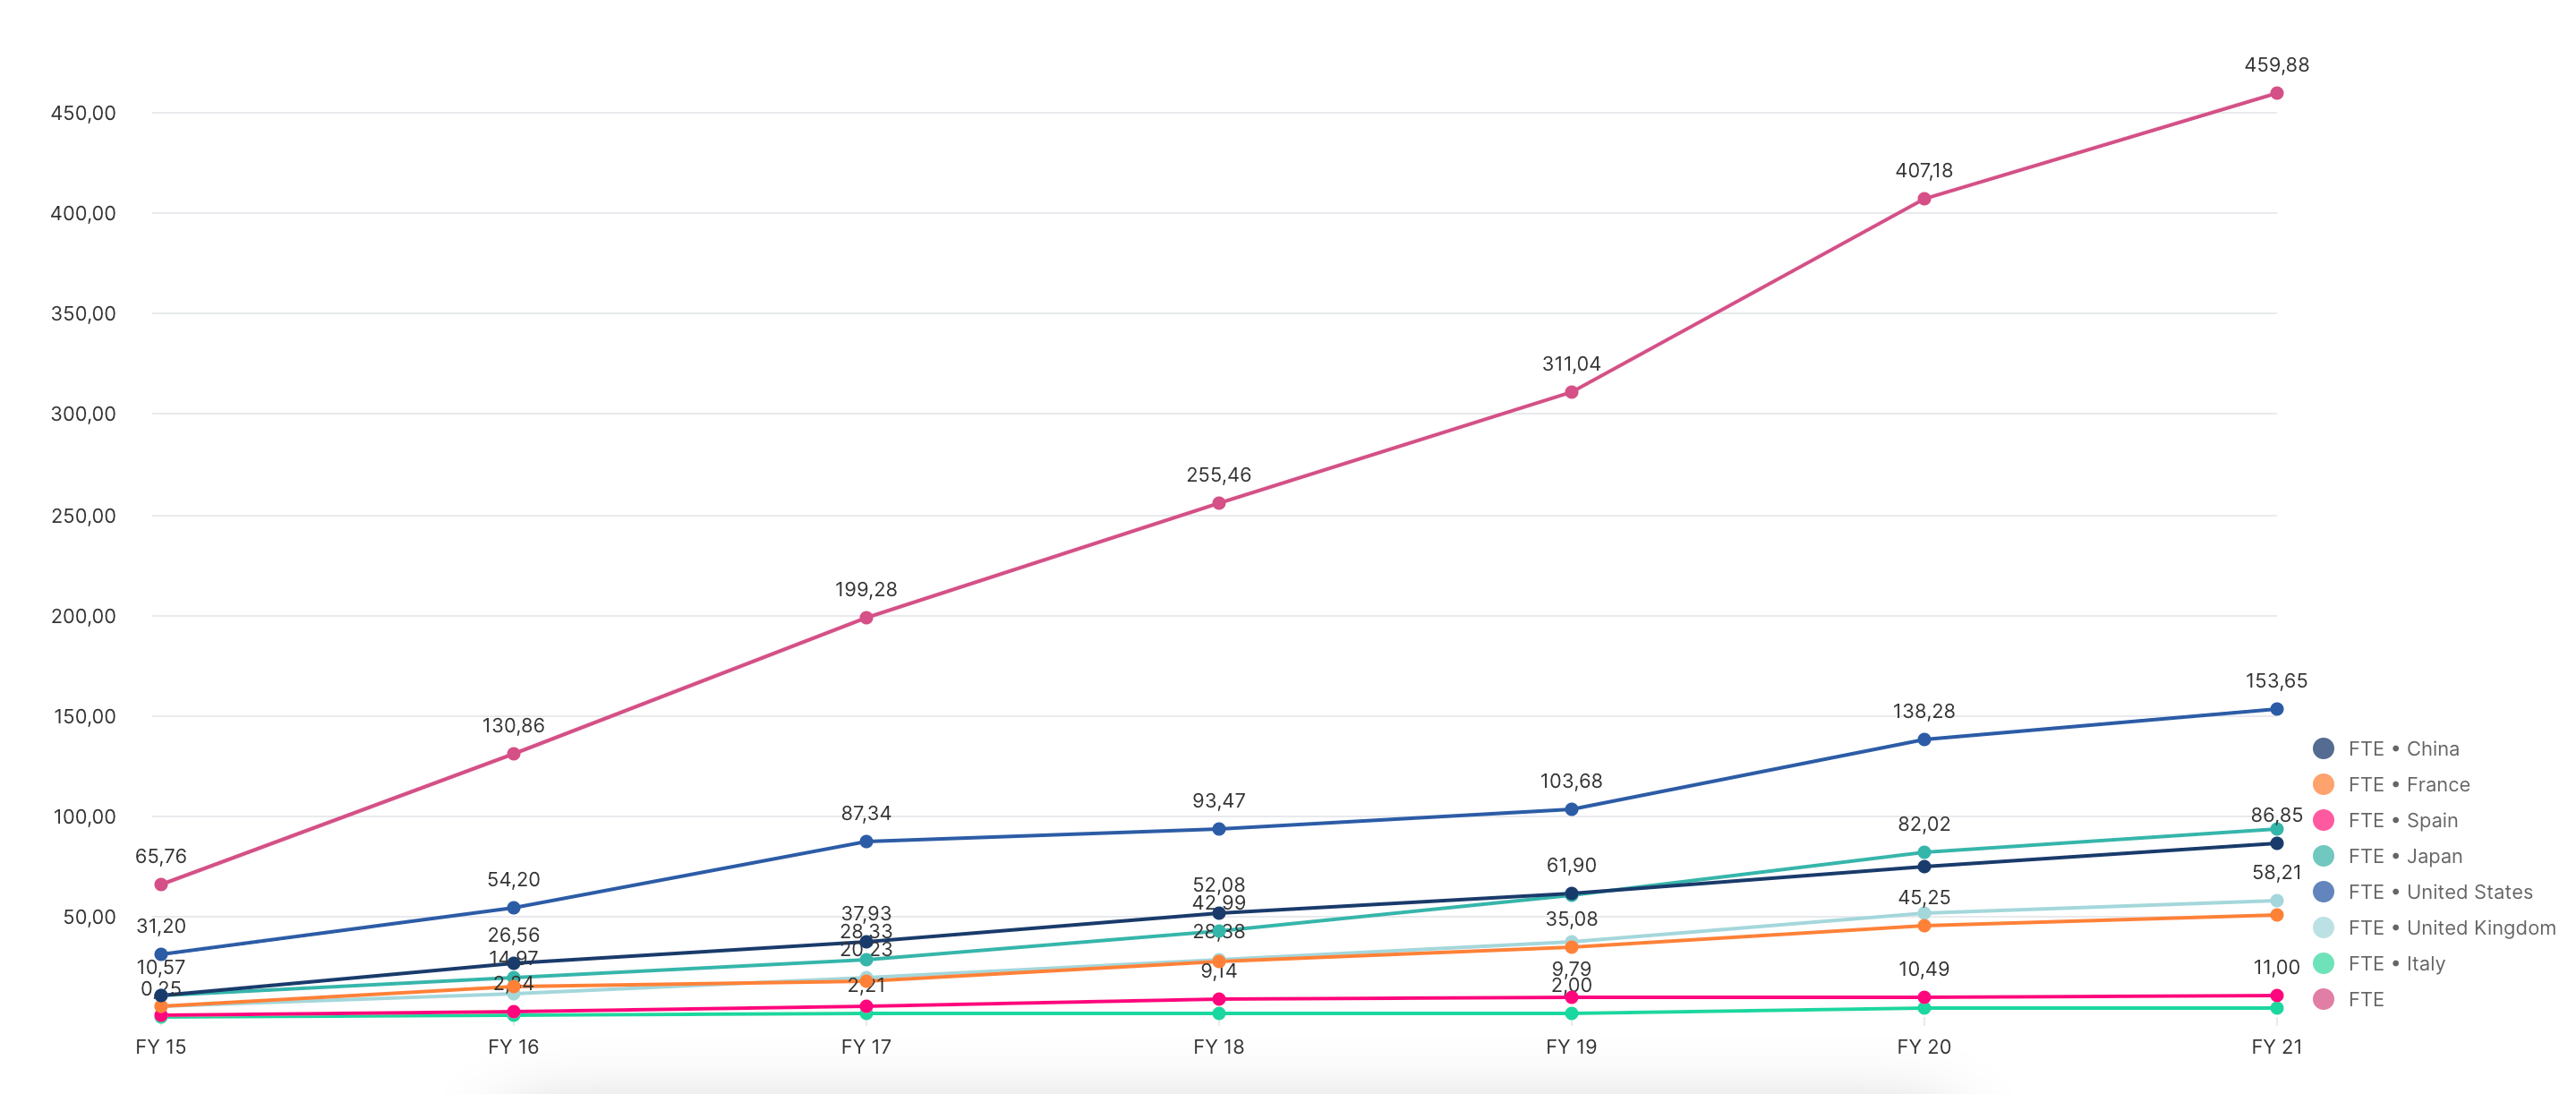
I would like to be able to show Aggregate (aka SUM or AVERAGE) values in charts on Tables or Metrics. When creating an aggregate field in Pigment on the Grid View, you can see Totals or when using Show Value As you can see items like Revenue per customer (Revenue and # of Customers are two separate metrics). However, when moving to Chart View the aggregate values are not visible in the Chart View


Log into the Pigment Community
No account yet? Create an account
Single Sign-On Need help?
Log in with your Pigment accountEnter your E-mail address. We'll send you an e-mail with instructions to reset your password.