

We’re excited to launch a new initiative in the Pigment Community: the Topic of the Month!
Each month, we’ll post a quick poll to spark curiosity, gather insights, and learn from one another. These polls are designed to be fun, easy to answer, and a great way to see how fellow Pigmenauts approach everyday challenges in Pigment.
For our very first poll, we’re tackling a question many of us face:
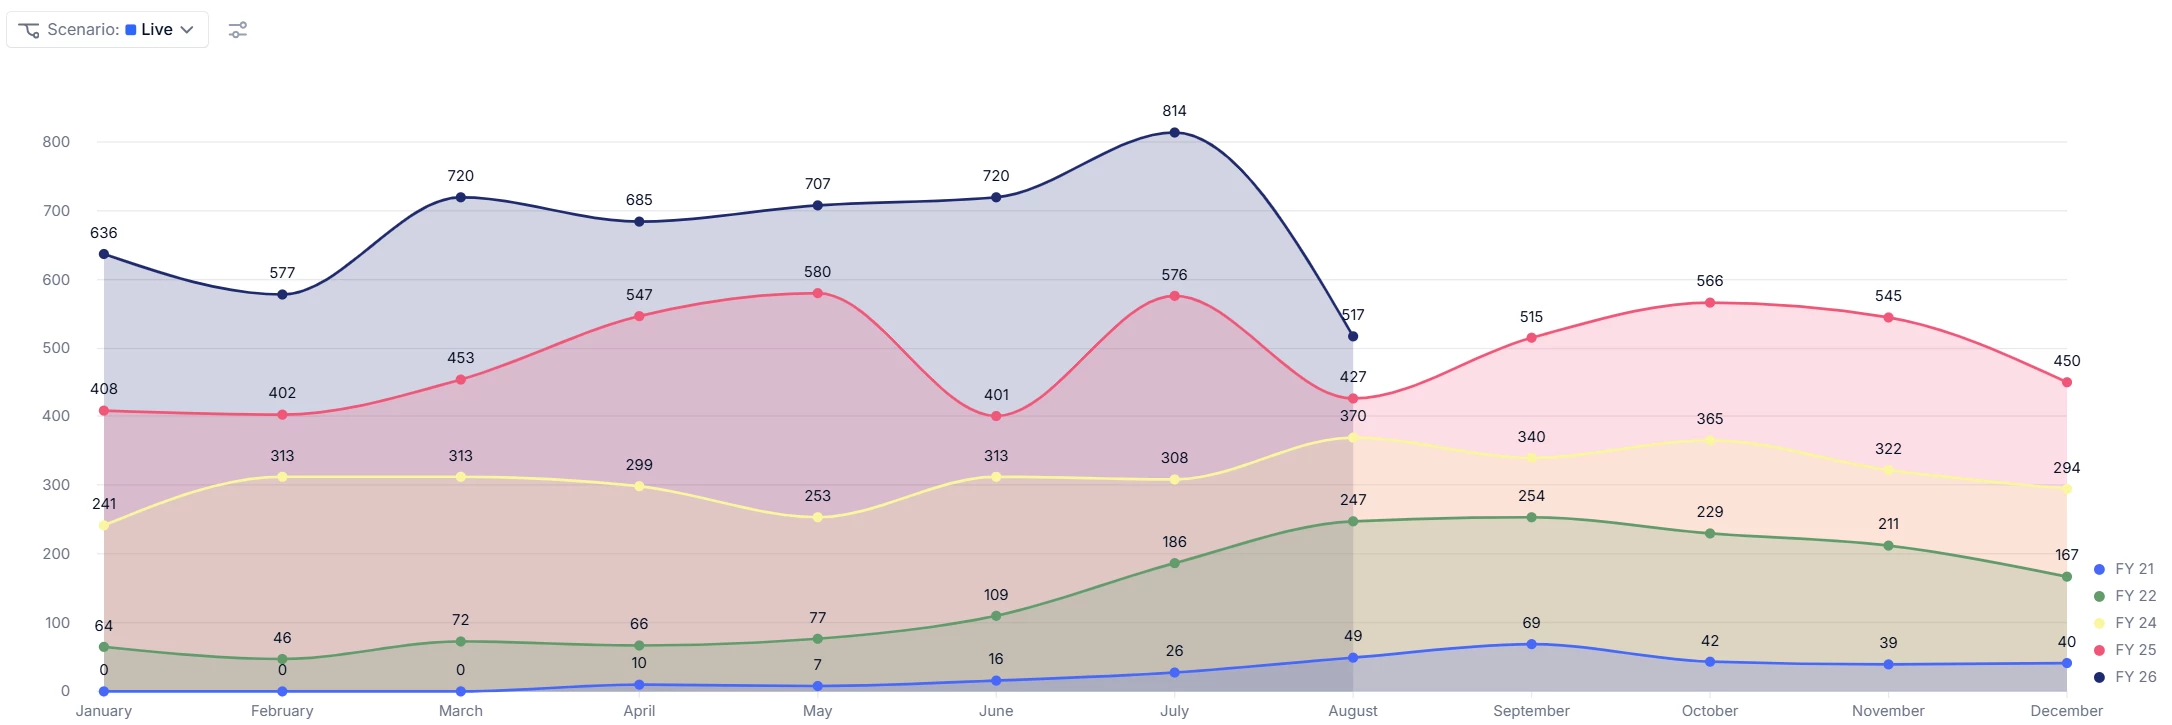
Which visualization do your stakeholders love most?
After you vote, don’t stop there! Share your go-to chart in the comments 👇 Screenshots, success stories, or lessons learned are all welcome. Let’s kick off this new series together!