
Hi Everyone,
I am looking for a way to visually group and indent independent Metrics on a Pigment Board to create a hierarchy, similar to a traditional P&L view.
The Setup: I have four separate Metrics, each calculated using its own formula:
-
Other Operational expenses(The parent/total) -
Warehouse expenses -
Transportation cost -
Other expenses
The Goal: I have added these four metrics to a Pivot table. I want to arrange them so they appear grouped together, with the sub-categories indented under the total, like this:
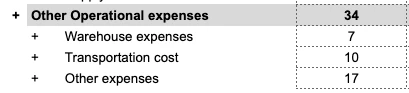
The Question: Is there a way to achieve this visual "parent-child" grouping directly on a Board or Pivot table without creating an additional "Reporting" dimension or a mapping metric? I’m trying to keep the model lean and avoid manual maintenance of a consolidation dimension if possible.
Are there any "Display" settings or Pivot configurations that allow for custom indentation or visual nesting of independent Metrics?
Thanks in advance for the help!