
Organization Chart (Org Chart) filters let you highlight in your Org Chart based on specific criteria such as location, position, or level.
Org Chart filters preserve the chart’s hierarchy while highlighting cards that match your criteria. You can apply multiple filters to show or hide Items that don’t match your search criteria. Default filters can be set to automatically apply values to your chart and instantly provide Members with the most relevant View.
This guide outlines how to set up filters that can be accessed directly in the Org Chart.
 Resources
For more information on Org Charts, see our Org Chart resources:
Set up filters
In the Table you used to set up your Org Chart:
- Select Chart.
- Select Format.
- In the Primary data section of the Format panel, select Interactions options.
- Select + Add a filter, then select the source data from the dropdown menu. You can add multiple filters to your chart and set default filters that are automatically applied when the chart opens.
- Filters apply only to primary data (i.e., the most granular level of your Org Chart, such as Employee).
- Choose the specific Dimension Properties or values of the underlying Table that you want to filter by in your chart.
- Set specific default filters to automatically display the most relevant view of the Org Chart when it opens. Users can change or clear filters, but the chart resets to the default filters once reloaded.
- Use Item Variables as filter values to make your chart dynamic. You can override Item Variables directly in the Filter panel and changes will automatically reflect in the chart filters. For more on how to use Item Variables with filters, see What are Item Variables?
 Important
Filters cannot include properties of type Dimension. Properties must be modeled as Metrics of the primary Dimension for use in filters.
- Go to Settings, then Filtered items, and select Show or Hide to control whether the filtered Items appear on the Chart by default. Hide filtered Items is available only when groups are used, and Display primary data inside groups is toggled On.
- Select Save View.
Use the filters
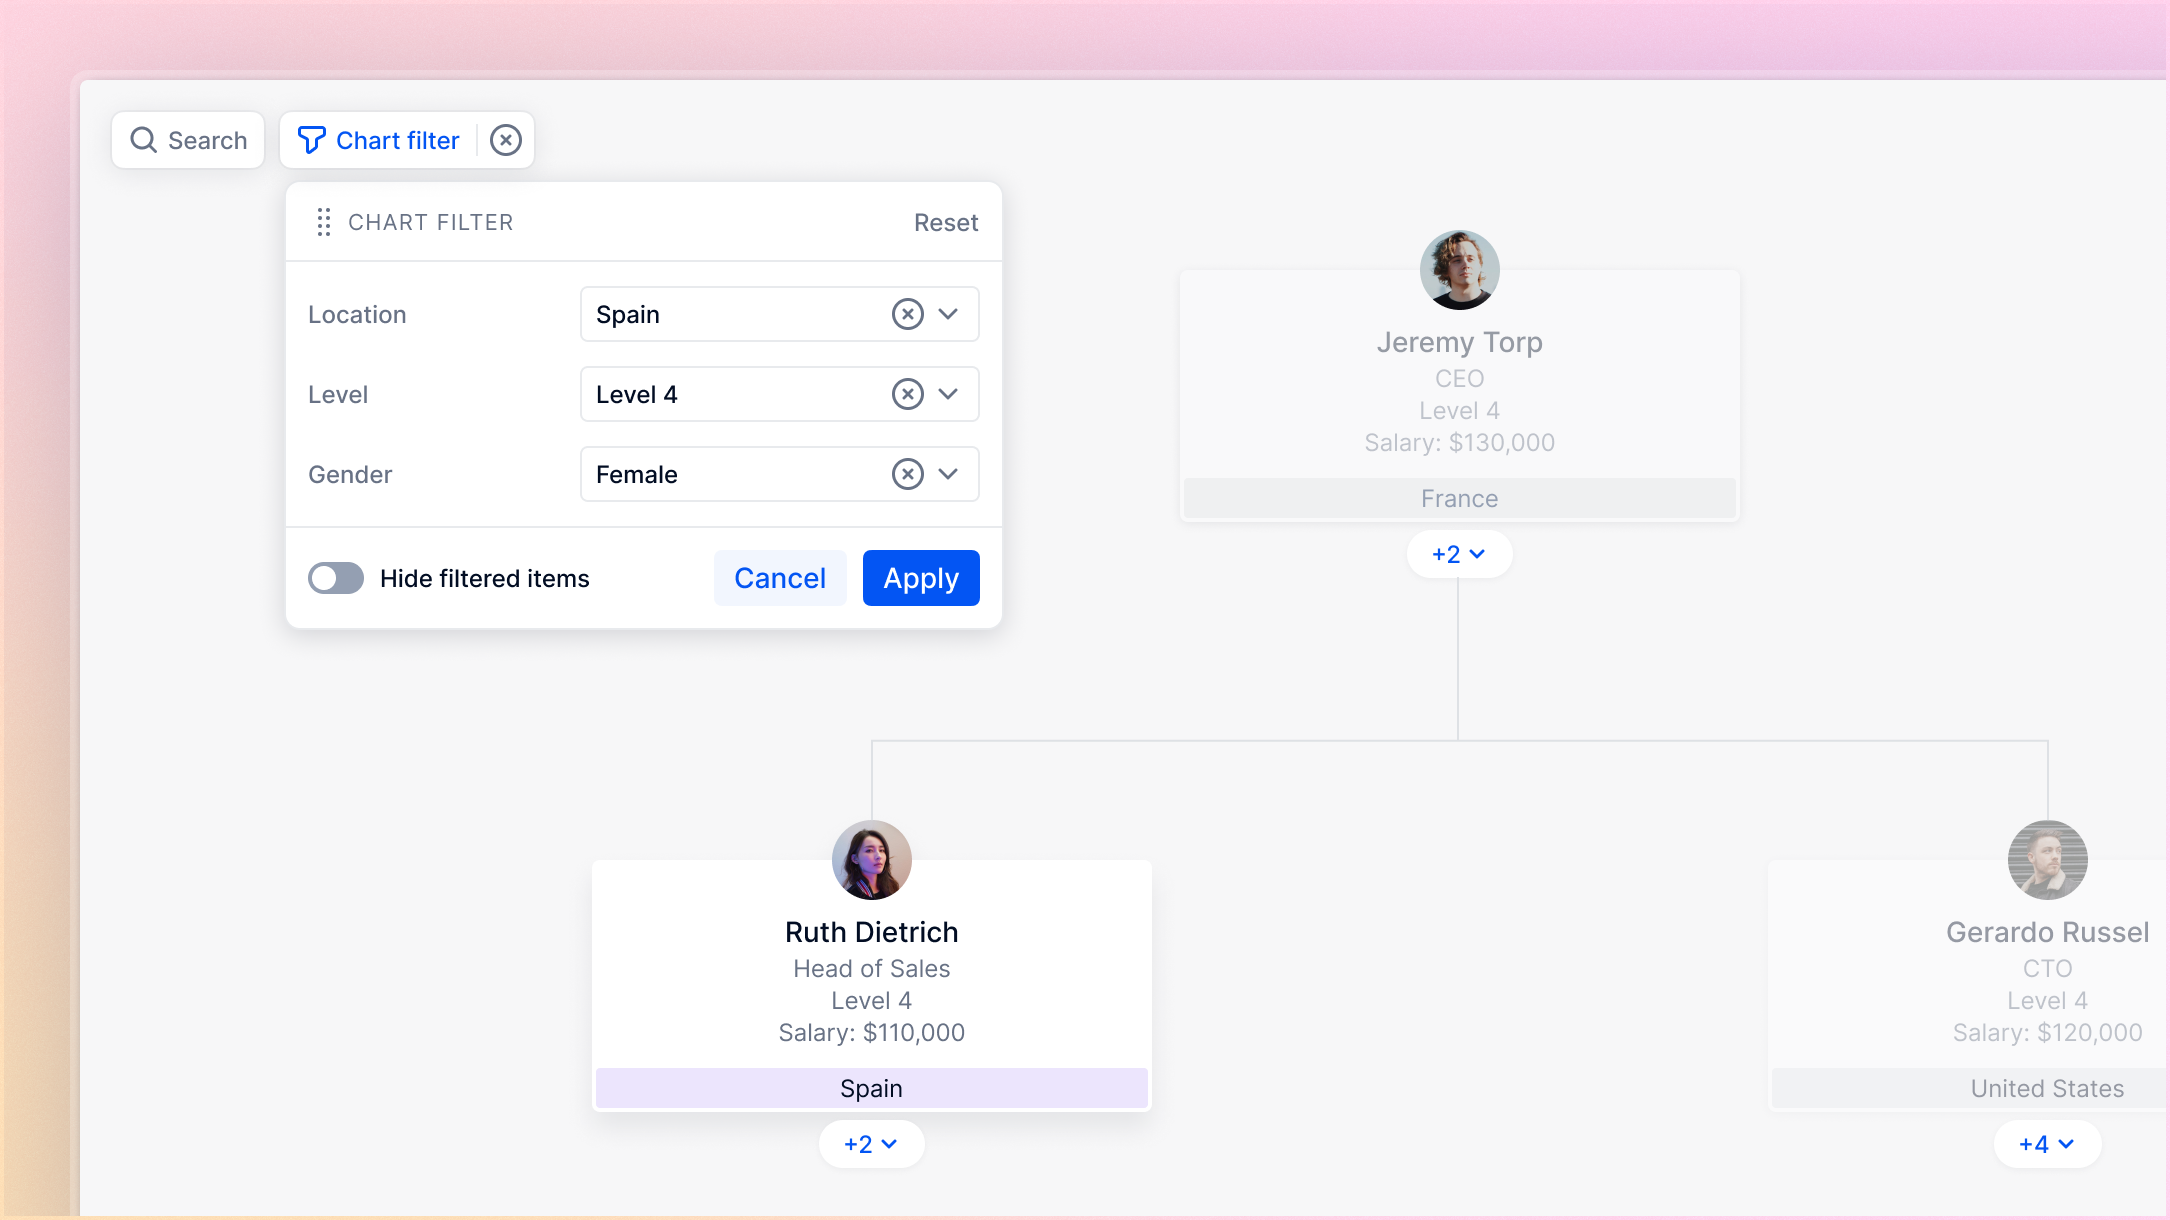
You can filter your chart using one or multiple filters. When applying multiple filters, at least one value from each selected filter must be met to display highlighted results.
For example, if you apply a Position Country filter for Spain and Italy and a Position Level filter for Level 2, the chart will display data matching at least one selected country and the specified level. If no employees hold Level 2 positions in Spain or Italy, the chart’s cards will be greyed out.
 Note
Note
The Chart filter button shows the number of filter values applied to the chart.
To access the filters from your Org Chart:
- Go to your Org Chart.
- Select Chart filter in the top-left corner of the Chart. Filters will always appear in your Organizational Chart.
- Select the specific values for each Filter(s). You can change or clear filters, but the chart resets to the default filters once reloaded.
- Select Apply.
Hide filtered Items
The Hide filtered items option hides Items on the Chart that don’t meet the criteria of the selected values, rather than greying them out. It is available only when groups are used, and Display primary data inside groups is toggled to On.
To hide filtered Items once you have applied your filter(s):
- Select Chart filter in the top-left corner of the chart.
- Toggle Hide filtered items to On.
- Select Apply.