Versioning is fundamental in Pigment to structure your planning data across Actuals, Budgets, and Forecasts. Here are the essential concepts and steps to implement it effectively.
What is a Version or a Plan?
One of the most common use cases in Pigment is the creation of planning cycles (also known as version planning or scenario planning). This is where users build out a variety of plans based on their business data, with each plan leveraging different assumptions producing their own results. The final step is to compare these plans in variance reports, build waterfall charts to get actionable insights and save these plans for future reference.
Common Types of Plans
- Budget: A fixed annual plan, usually built at the start of the fiscal year. It serves as a target for both internal and external stakeholders and acts as a baseline to measure performance. Budgets shouldn’t be adjusted once finalised.
- Reforecasts: Structured, periodic updates to the original forecast or budget (e.g. Q1, Q2, Q3 Reforecasts). These are used to reassess performance mid-year and adjust expectations based on new data.
- Live Forecast / Rolling Forecast: An evolving plan that reflects the most realistic expectation of business performance. It combines actuals to date with forecasted data for future months and is regularly updated to stay aligned with current trends.
💡 Key difference: Budgets are static targets; Forecasts and Reforecasts are dynamic expectations that evolve with reality.
Each of these plans can be broken down into several scenarios each containing different assumptions, such as:
- Reforecast Q2 Optimistic
- Reforecast Q2 Expected
- Reforecast Q2 Pessimistic
Types of Data in a Plan
Each plan (as listed above) typically includes two types of data:
- Actuals: Historical data from past months, imported directly from business systems (e.g. accounting data from NetSuite, sales data from Salesforce, employee data from HRIS).
- Plan Data: Future-looking data generated through projections, assumptions, and calculations.
The way these two types of data are combined is specific to each version created and is managed through a Switchover Month logic, which will be explained in Section 3 below.
The rest of this article will walk you through the key steps to building an efficient versioning system in Pigment, by leveraging a Version dimension, the switchover logic and the data type information—one that balances flexibility for business needs with a clear and easy-to-maintain model architecture.
1. Create a Version Dimension
Start by creating a unique Version Dimension using a standard dimension list. This will hold all your versions, for example:
- Budget FY26
- Forecast 3+9 FY26
- Reforecast Q2 FY25 Pessimistic
Leveraging a dimension list that can be referenced in formulas and used in Metric structure to layer your data, will allow you to maintain the flexibility needed to address a wide range of planning processes and make sure you can meet all sorts of planning requirements.
Why use a Version dimension instead of the Scenario feature?
Pigment’s Scenario feature is built for quick, ad-hoc comparisons—ideal for testing assumptions or simulating short-term impacts. It offers instant flexibility for exploring “what-if” cases without needing to modify your core model structure.
However, when it comes to structured, recurring planning cycles, the use of a Version Dimension is the more appropriate choice. Here’s why:
✅ Version Dimension is Better Suited For:
- Long-term, structured planning processes like Budgets, Forecasts, and Reforecasts
- Modeling at scale, since it behaves like any other Dimension and can be fully integrated into formulas, data blocks, and access controls
- Initialising new planning cycles, leveraging features like “Clone Data”
- Consistent reporting and variance analysis over time
⚠️ Limitations of the Scenario Feature for Planning Cycles:
- Not treated as a classical dimension, which limits its use in data blocks and formula logic
- Less suitable for initialising new plans and managing user access
- Not ideal for auditability or structured version tracking
💡 In short: Use Scenarios for rapid “on-the-fly”simulations. Use the Version Dimension when planning needs to be repeatable, auditable, and deeply integrated into your model.
2. Populate the Dimension with Version Items
Add one item per planning cycle in your Version Dimension to represent each version used (e.g. “Budget 2024”, “Reforecast Q1 2025”). We recommend including either the creation year or the version window span in the name. Both naming approaches are valid and can be automated with formulas in your Version dimension properties—the most important is to remain consistent and user-friendly.
🔍 The year in the version name can refer to either the creation date or the period the plan covers—especially helpful when versions span multiple years.
Why Include the Creation Year/Window Span in the Version Name?
Using this structure improves clarity, helps maintain a clear, chronological record of your planning cycles, and simplifies version initialisation. Since each version acts as a data layer, you can quickly create new ones by copying assumptions from previous cycles using the “Clone Data” feature, saving time and ensuring consistency across planning iterations. By structuring versions by creation year or windows span, you create a repeatable and scalable framework for planning across time.
3. Add Switchover Logic
Include a Switchover Month property in your Version Dimension to define the last month of actual data that will apply to each Version separately. This switchover logic ensures your forecast picks up where your actuals end, maintaining continuity for rolling forecasts.
Examples:
- Budget FY26: Contains actuals up to December 2025, pulled from source systems. The remaining months (January–December 2026) are projected using planning logic and assumptions.
- Reforecast Q1 FY26: Similar to the budget, but includes actuals for the first three months of FY26 (e.g. Jan–Mar 2026). The remaining months (April–December 2026) are recalculated based on updated insights, making the forecast more accurate than the Budget FY26.
🔎 If your planning cycle is structured at the Year granularity instead of the Month, you can replace the Switchover Month property with a Switchover Year property instead. The approach remains the same: you’ll still create one Version item per planning cycle (based on creation year or version window span), and the switchover logic will apply at the Year level when crossed with your Year dimension.
Do You Need an “Actual” Version in Your Version Dimension?
Including an “Actual” version in your Version Dimension is optional, it will depend on your modeling and reporting needs.
Here are the main pros and cons to consider:
✅ Benefits of Having an Actual Version:
- Simplified References in Formulas: Having a dedicated “Actual” version makes it easier to reference actuals explicitly in calculations, especially when comparing against other plans.
- Improves Reporting Flexibility: Useful for reporting gaps between Reforecast cycles. For example, if you’re using Q1, Q2, Q3 Reforecasts, an “Actual” version can display data for months that fall outside those planning versions—such as April and May before Q2 Reforecast begins.
⚠️ Drawbacks to Consider:
- Redundant Calculations: Actuals are often already included in each plan version (via switchover logic), so the “Actual” version can introduce redundancy and additional recalculation of the same data.
- Model Complexity: Adding an “Actual” version introduces another layer to manage and maintain, which may not be necessary if your planning versions already include actual data where appropriate.
🔎 Recommendation: Use an “Actual” version only if:
- You need to explicitly isolate actuals in formulas or reports
- Your Reforecast cycle leaves gaps in actual coverage (e.g. You need to pull your May actuals before the Q2 Reforecast starts)
Otherwise, you may choose to omit it and rely on switchover logic within each version to handle actual months—keeping your model simpler and leaner.
⚠️ Warning: If you choose to include an “Actual” version in your Version Dimension, there’s no need to create multiple versions by year or time span (e.g. “Actuals 2023”, “Actuals 2024”). Instead, simply update the Switchover Month each new Month to bring in the latest actuals. This keeps your Version Dimension lean and avoids unnecessary duplication.
4. Add Standard Properties for Version Management
Mandatory properties in your Version Dimension
Include the following properties in your Version Dimension to manage it effectively:
- Start Month: The starting month of the version.
- End Month: The ending month of the version.
These properties will be useful to define the planning windows for each version: which months will be populated with actual data, which month will be populated with projections results
- Active Version: Boolean property to identify the currently active versions that are displayed for either input or reporting.
- Lock Version: Boolean property to lock versions from edits once approved.
These properties will be used to calculate Access Rights metric applied in rules to define if a version is open for edit or locked. The “Actual” version will always be locked for edit while the other versions will be open for edit during the planning cycle then locked once approved.
Optional properties in your Version Dimension
You can decide to add more properties if they suit your planning cycle process, but as opposed to the ones above, these will be optional:
- Version Type: Dimension type property used to categorise the different types of versions you will need to create (e.g. “Budget”, “Reforecast”, “Rolling Forecast”, “Long Range Planning”)
This property will be useful to:
- Reference your “Actual” version if you use one, to avoid directly referencing the Version item and referencing the Version type instead and ensure full compatibility with the Test & Deploy requirements (read this article for more information)
- Use different calculations rules based on the Version Type (e.g. more granular calculations on Budget and Reforecast than in Long Range planing)
- Scenario: Dimension type property used to categorise the different scenario of a particular version you will need to create (e.g. “Expected”, “Optimistic”, “Pessimistic”)
- Version #: Incremental number of your version used to create different occurrences of a single version for comparison purposes. Ultimately these different occurrences should be deleted to keep a single validated version that will be used later for reference.
Once setup, your Version dimension should look like this:
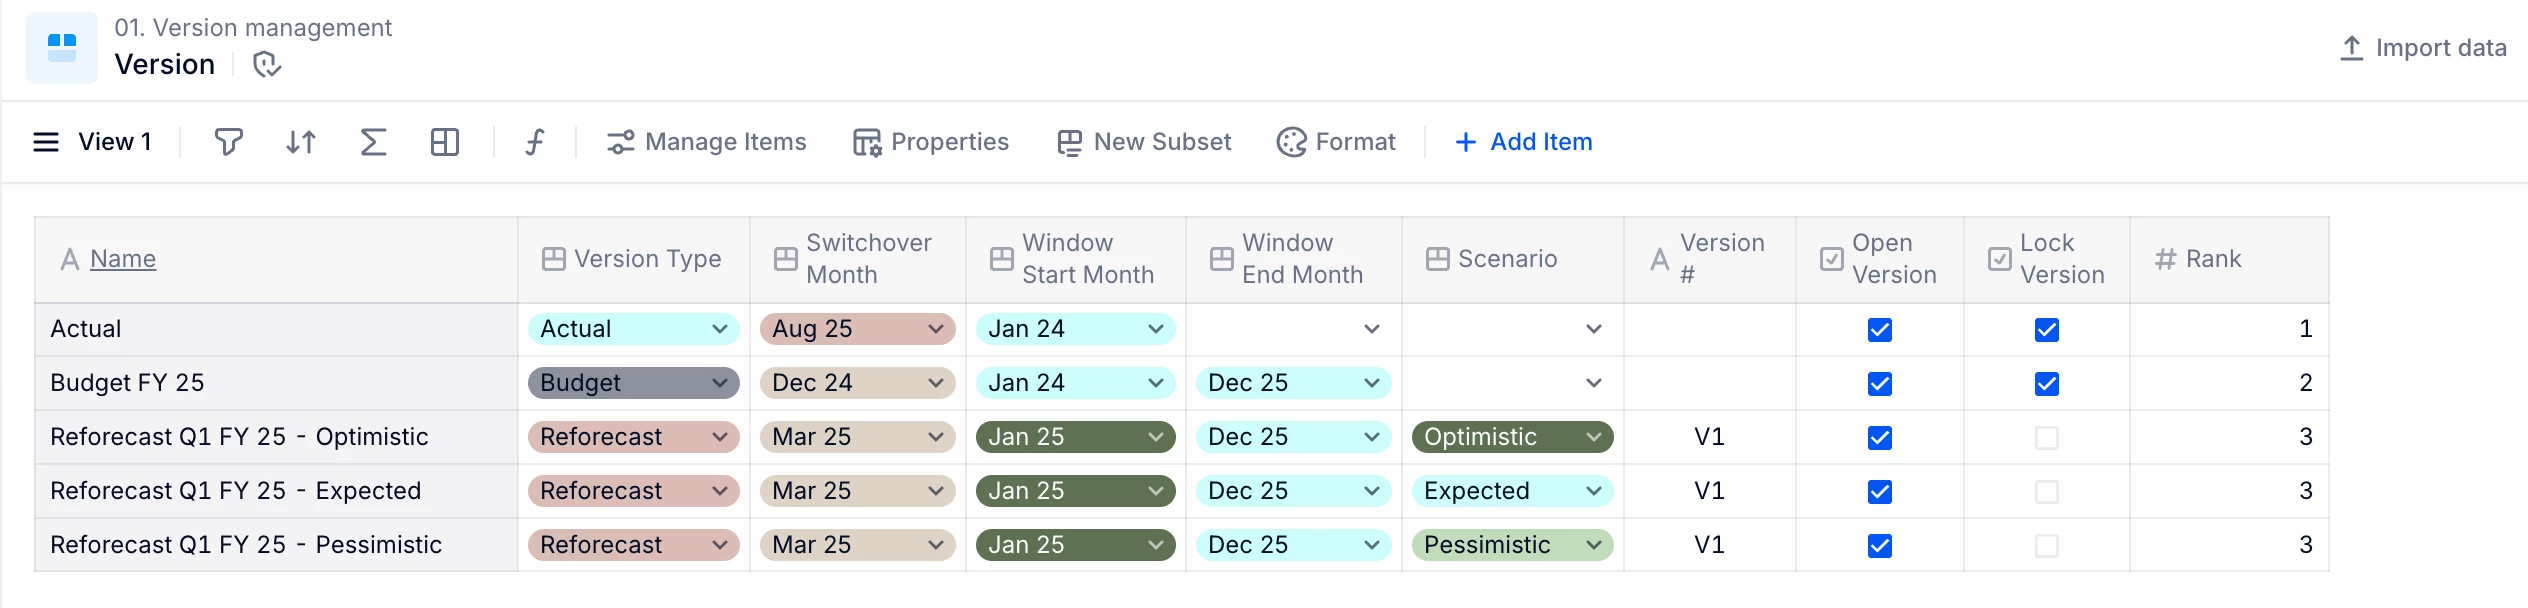
The final name of your Versions can be automated through formulas based on the “Version Type”, “Planning Years” (using the Switchover Month+1) or “Creation Year”, and “Scenario” and “Version number” if you decide to use them.
⚠️ Warning: Only keep active Versions currently used for planning or locked Versions needed for reference in this dimension. Regularly review and clean up the Version list to avoid keeping unnecessary or outdated items.
5. Create Key Version Metrics to layer the data by Versions
Create three Boolean metrics to define the Month range for each version:
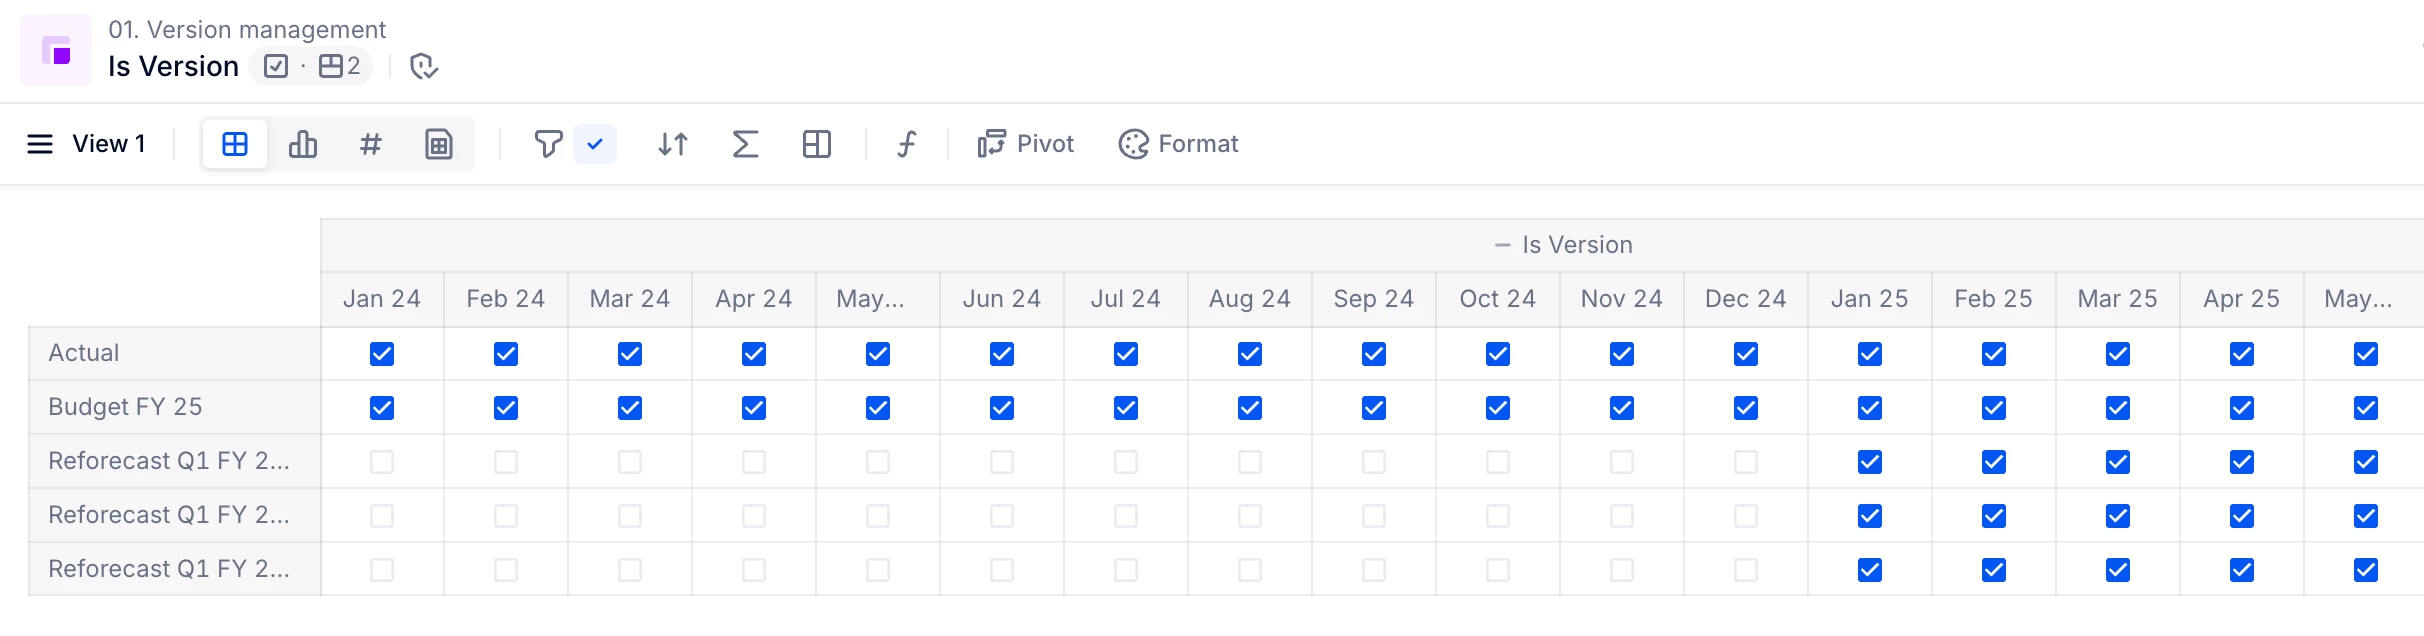
- Is Version: TRUE for months between the starting month and ending month. Define the version window
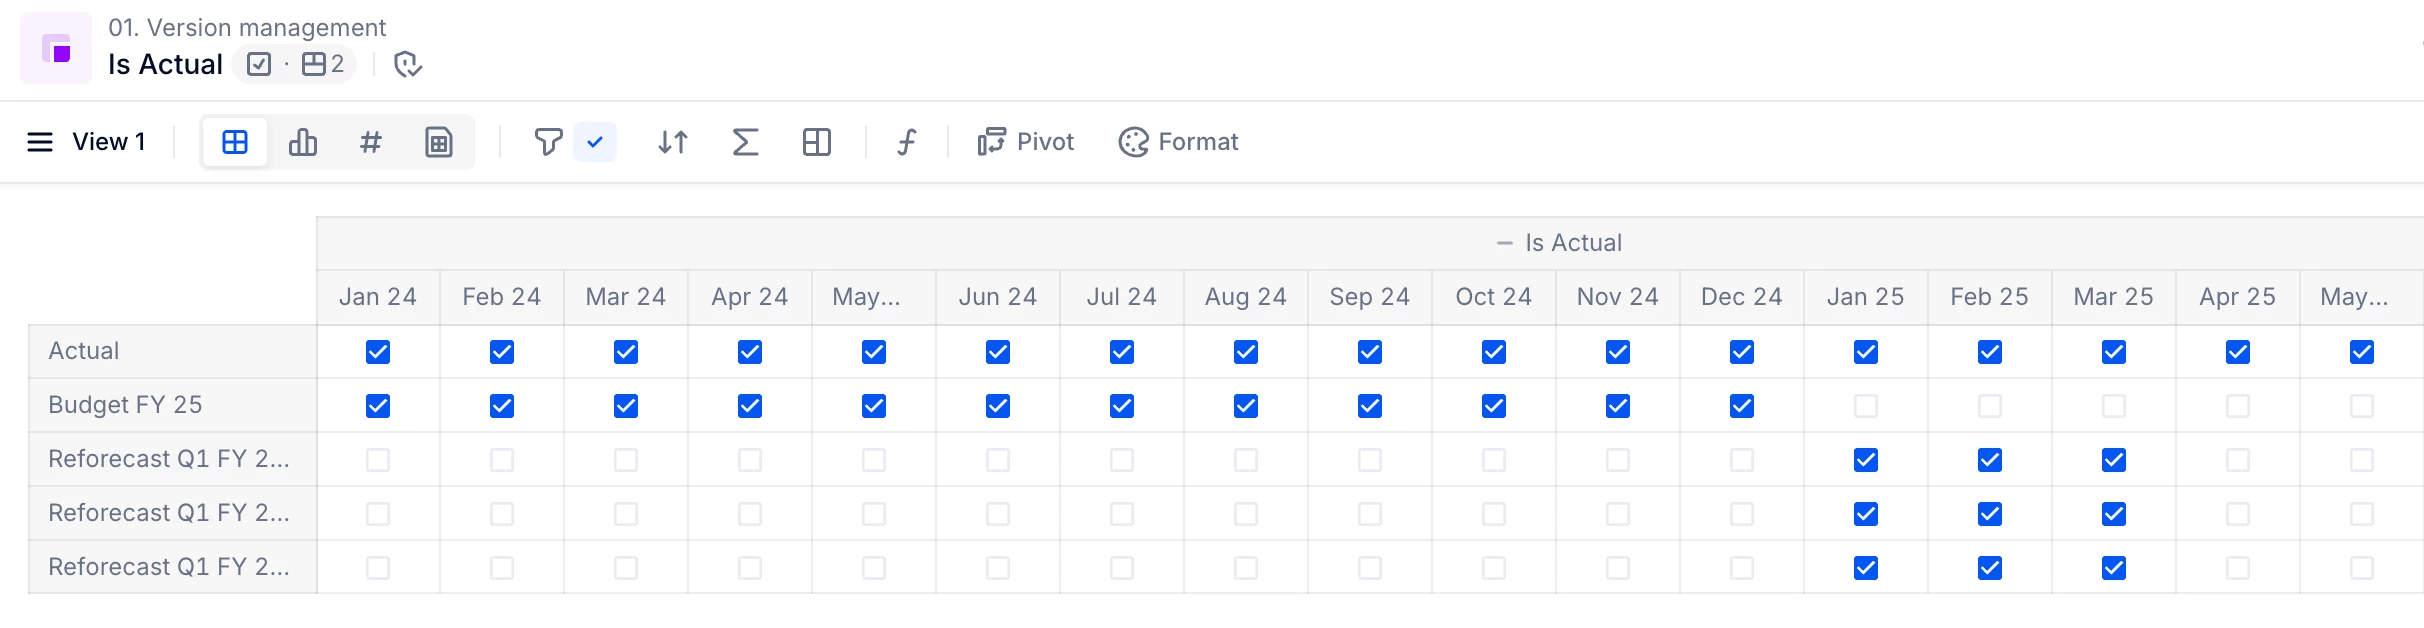
- Is Actual: TRUE for months inside the version window until the Switchover Month (included).
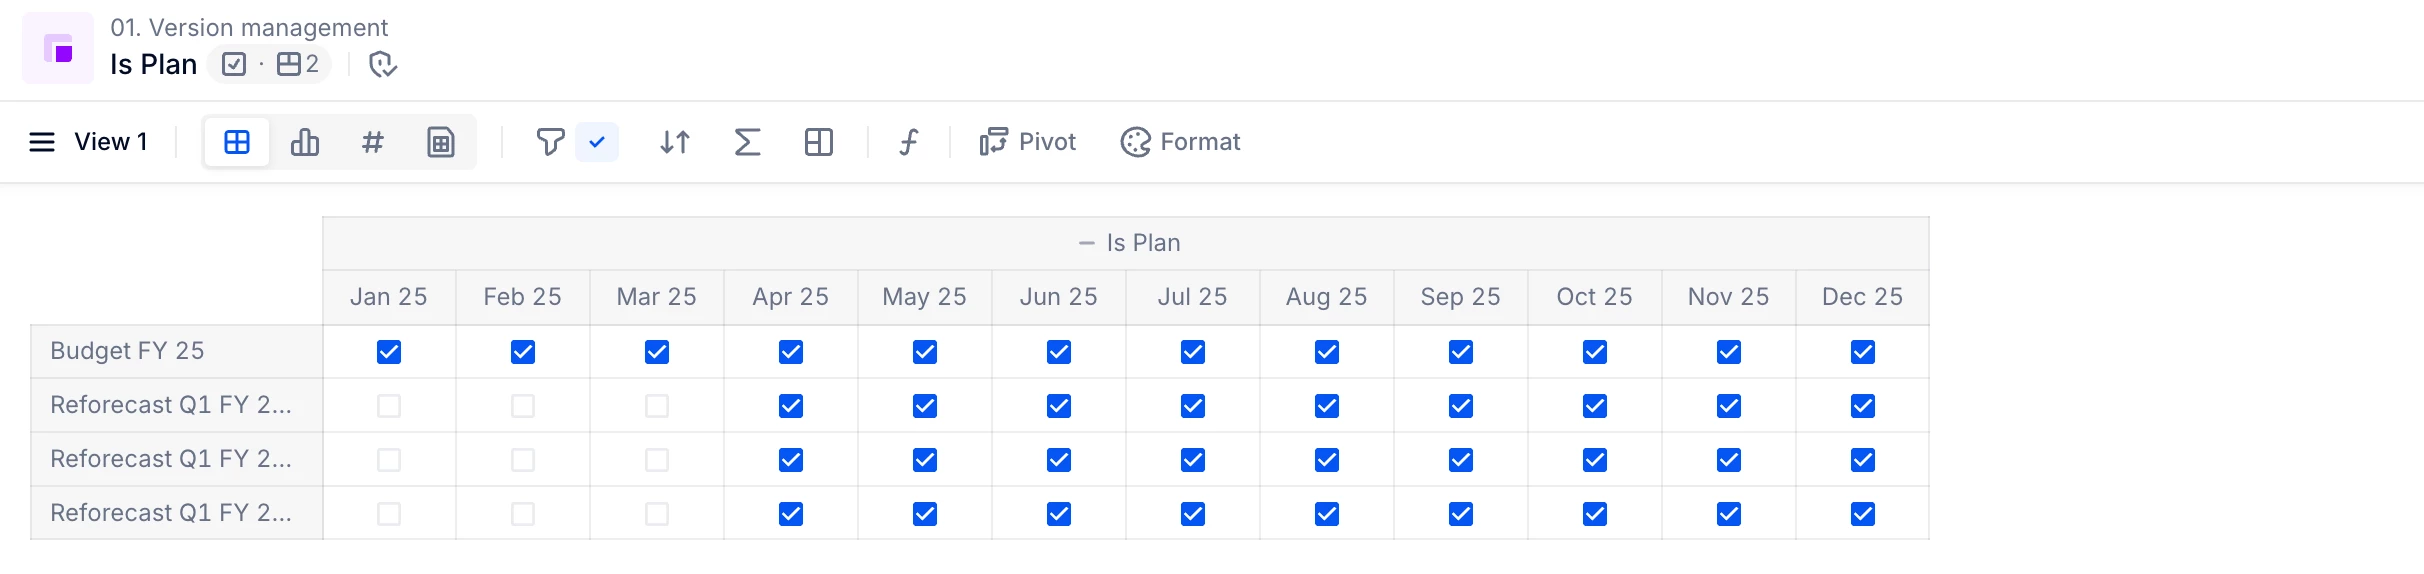
- Is Plan: TRUE for Months inside the Version window but after the Switchover Month.
These metrics, when used in formulas will allow you to:
- Layer data correctly by Version to bring actuals in each Version depending on the Switchover Month
- Apply different assumptions per version in your calculations and reports
6. Layer your Actual data and run your projection
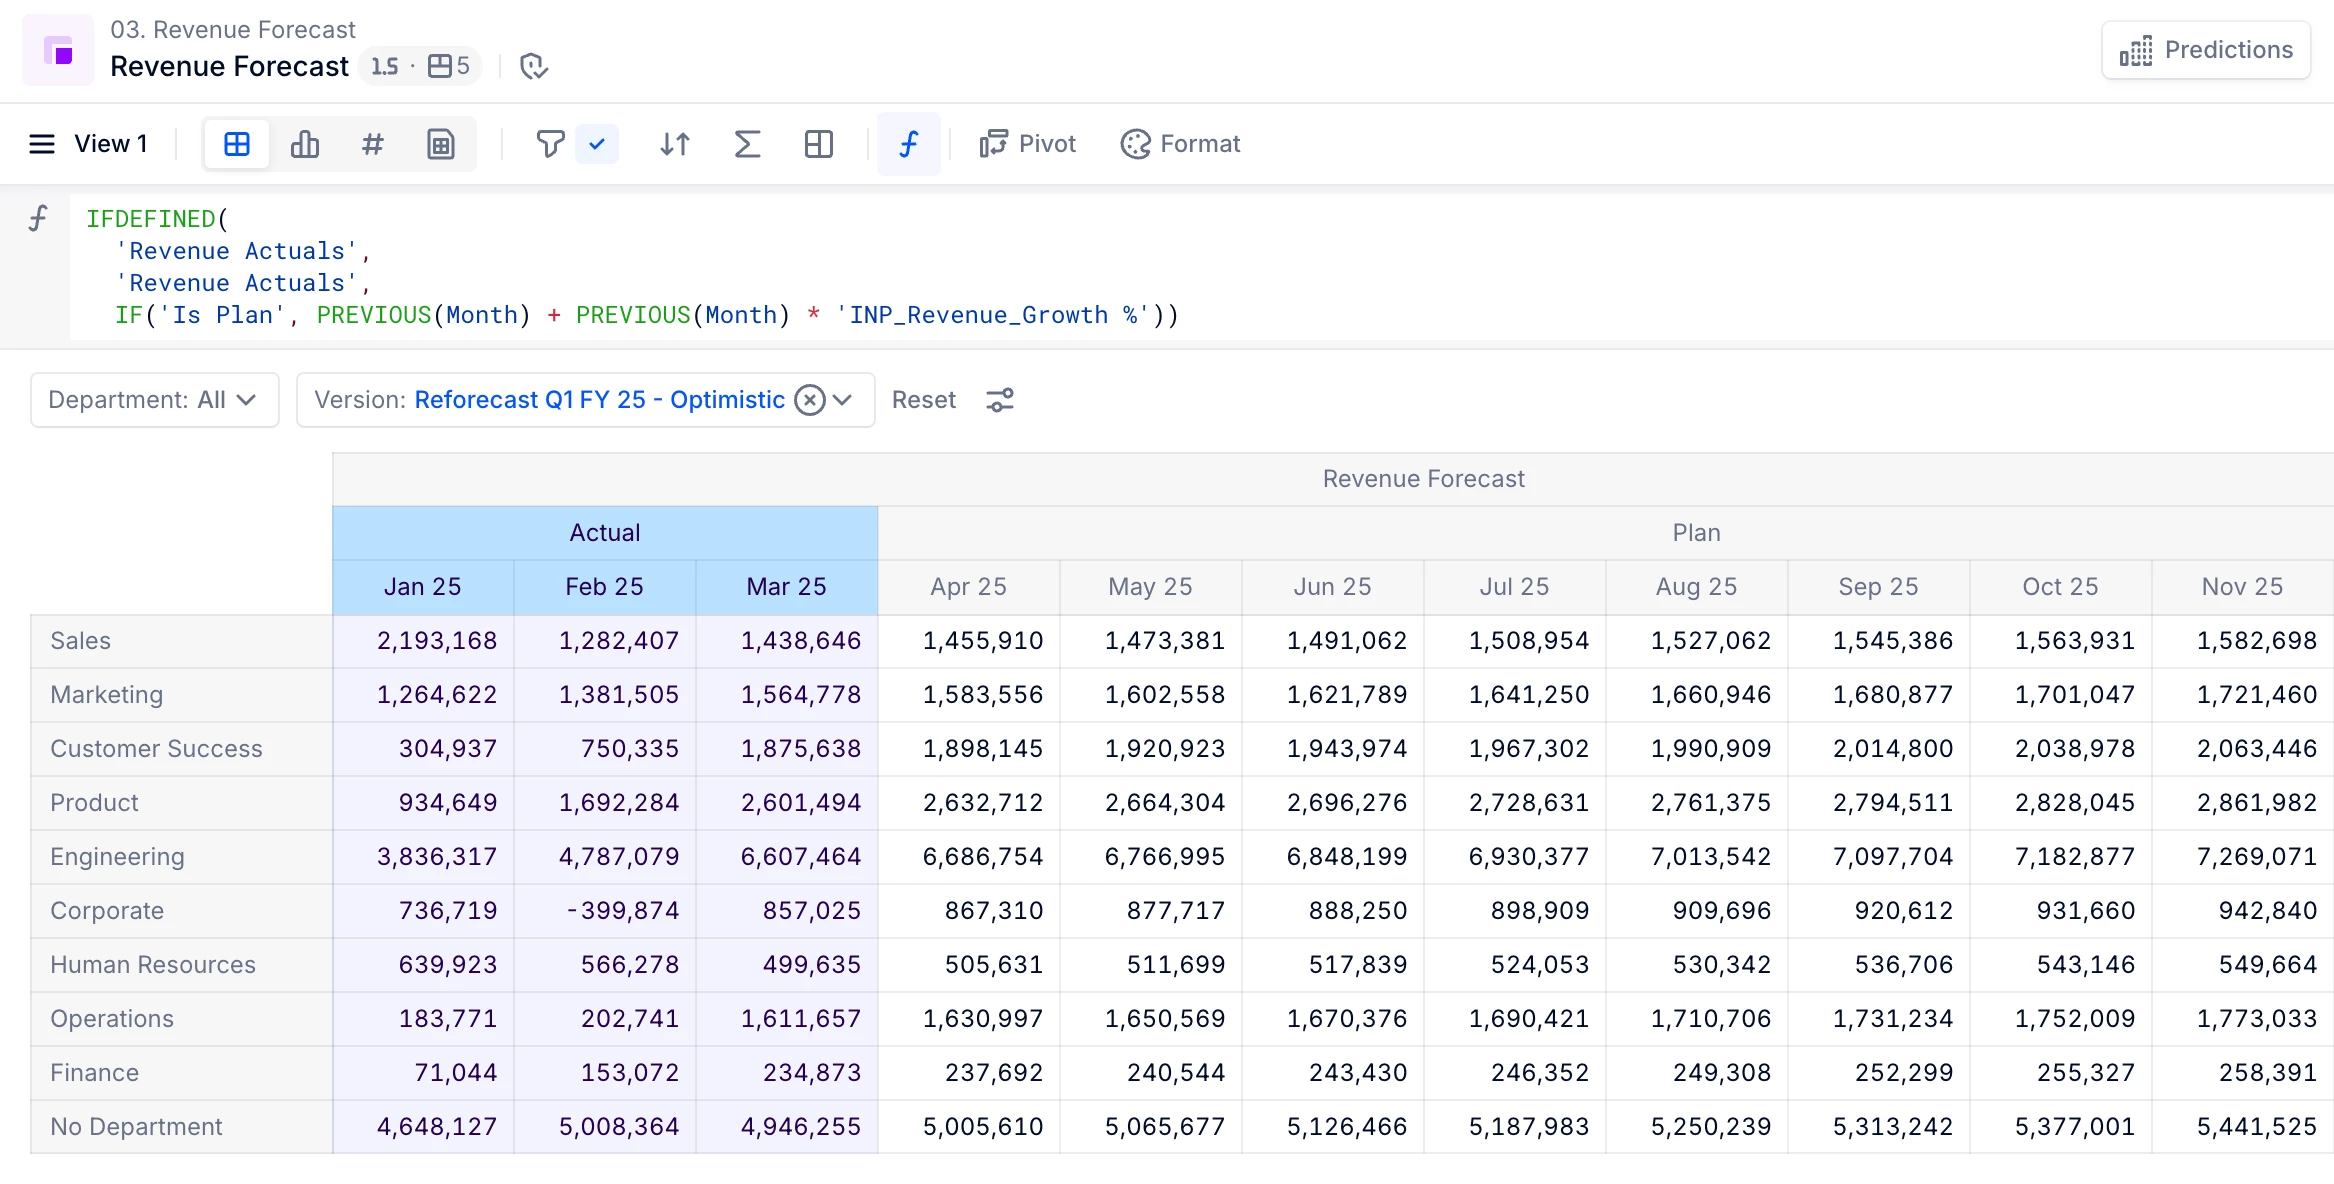
The final step will be to use your Key Version metrics in formulas combined with Actual data and assumptions to calculate your Version outputs. The following steps will be illustrated with an example on Revenue Projections, but it can be applied on any type of use case.
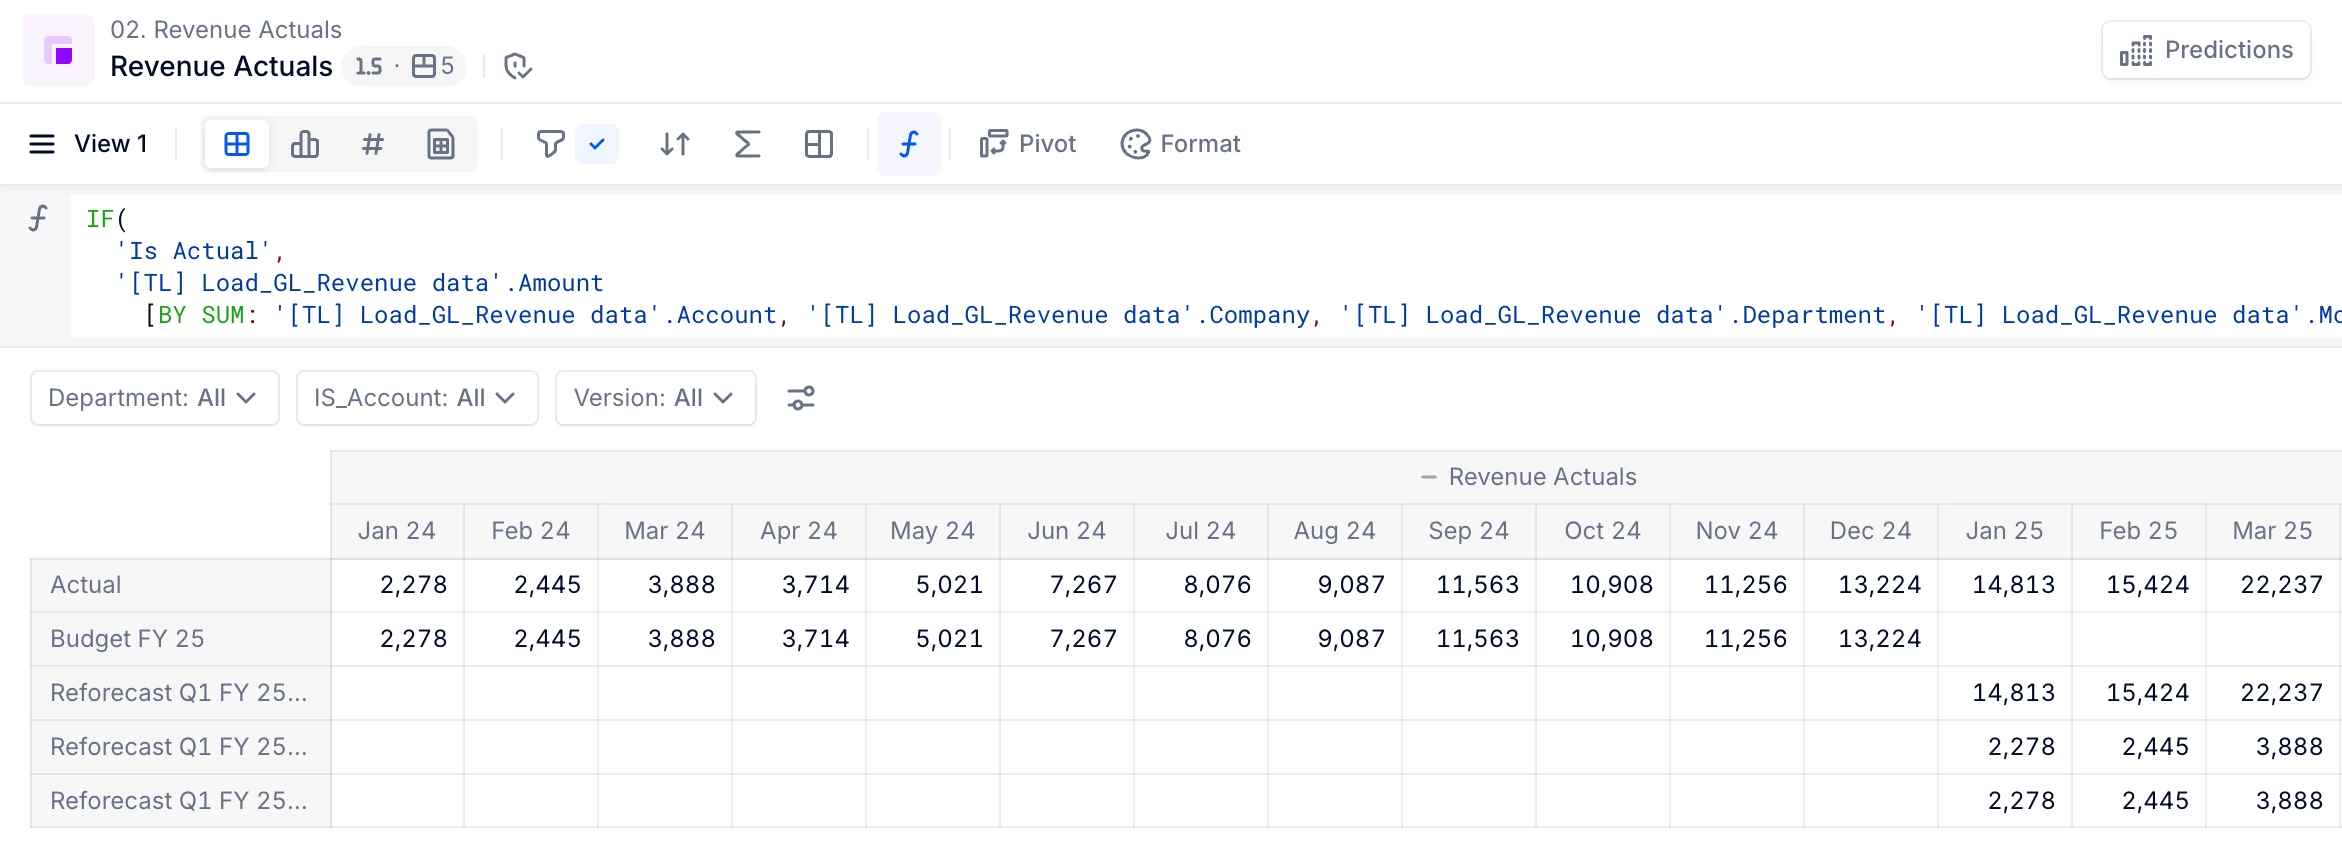
- Create a “Revenue Actual” metric by Version
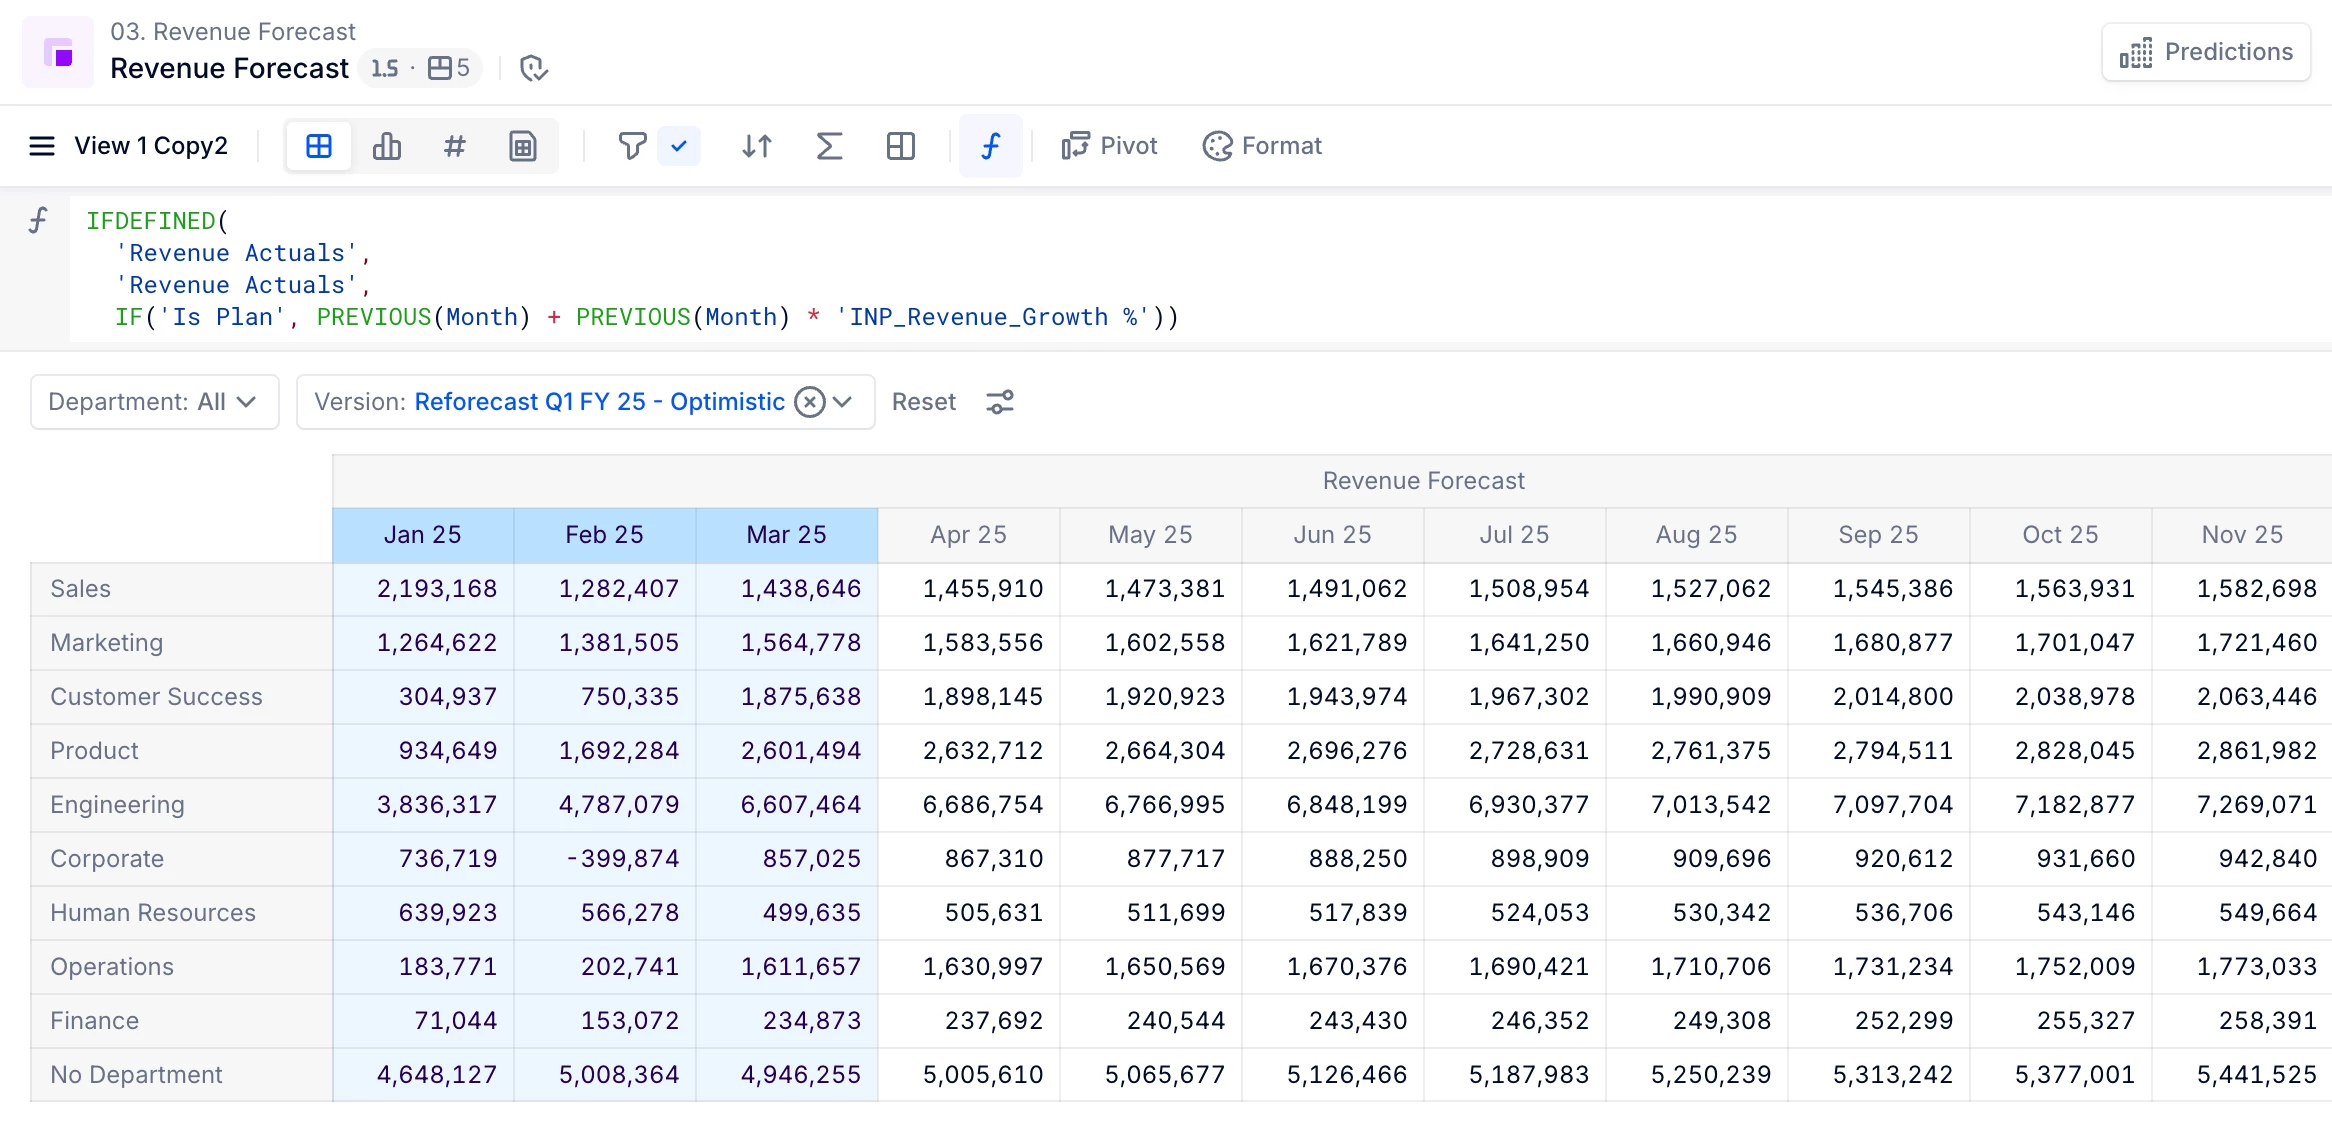
- Create a “Forecast metric” by Version (including “Actuals” data in blue font)
We now have a final Metric containing both our Actual data and Plan data depending on the Version’s Switchover Month, ready to be used in reporting and analysis.
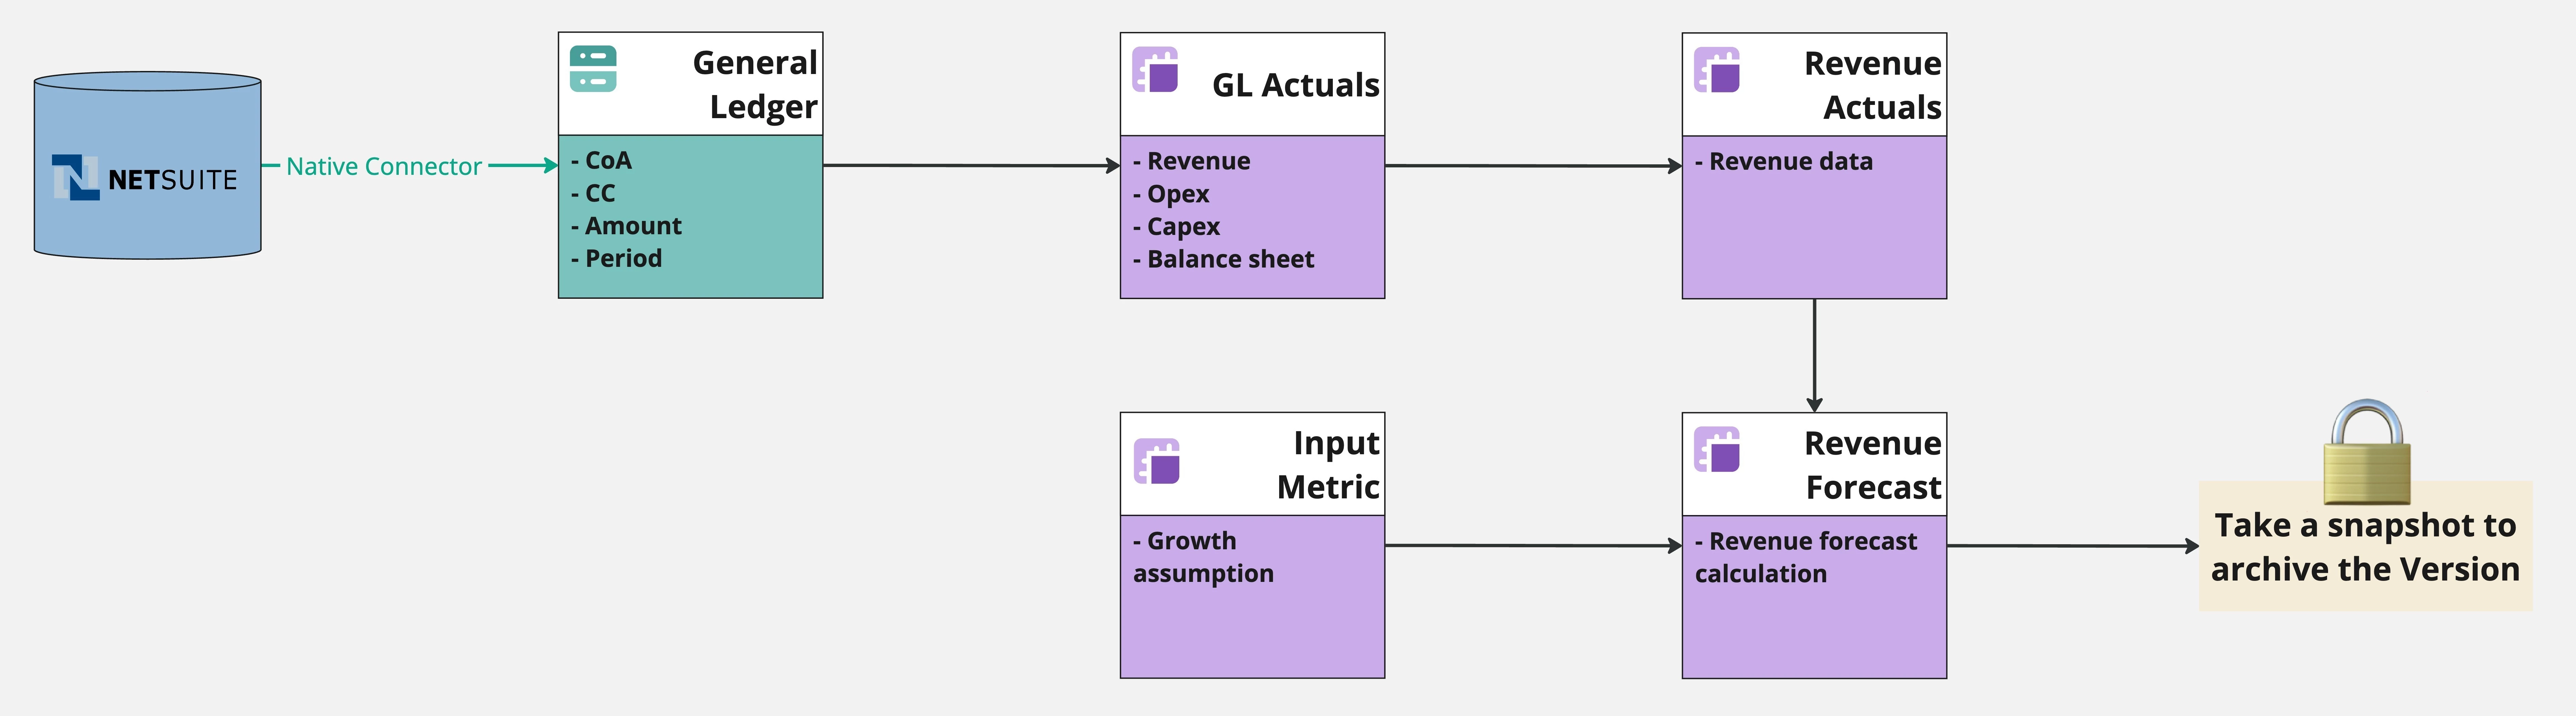
Here is a simplified end-to-end illustration of all the different steps we followed so far:
Read this article to know more about the different options available when it comes to archiving your data.
7. Bonus - Display the Data Type for each Version and Month using the Mapped dimension feature
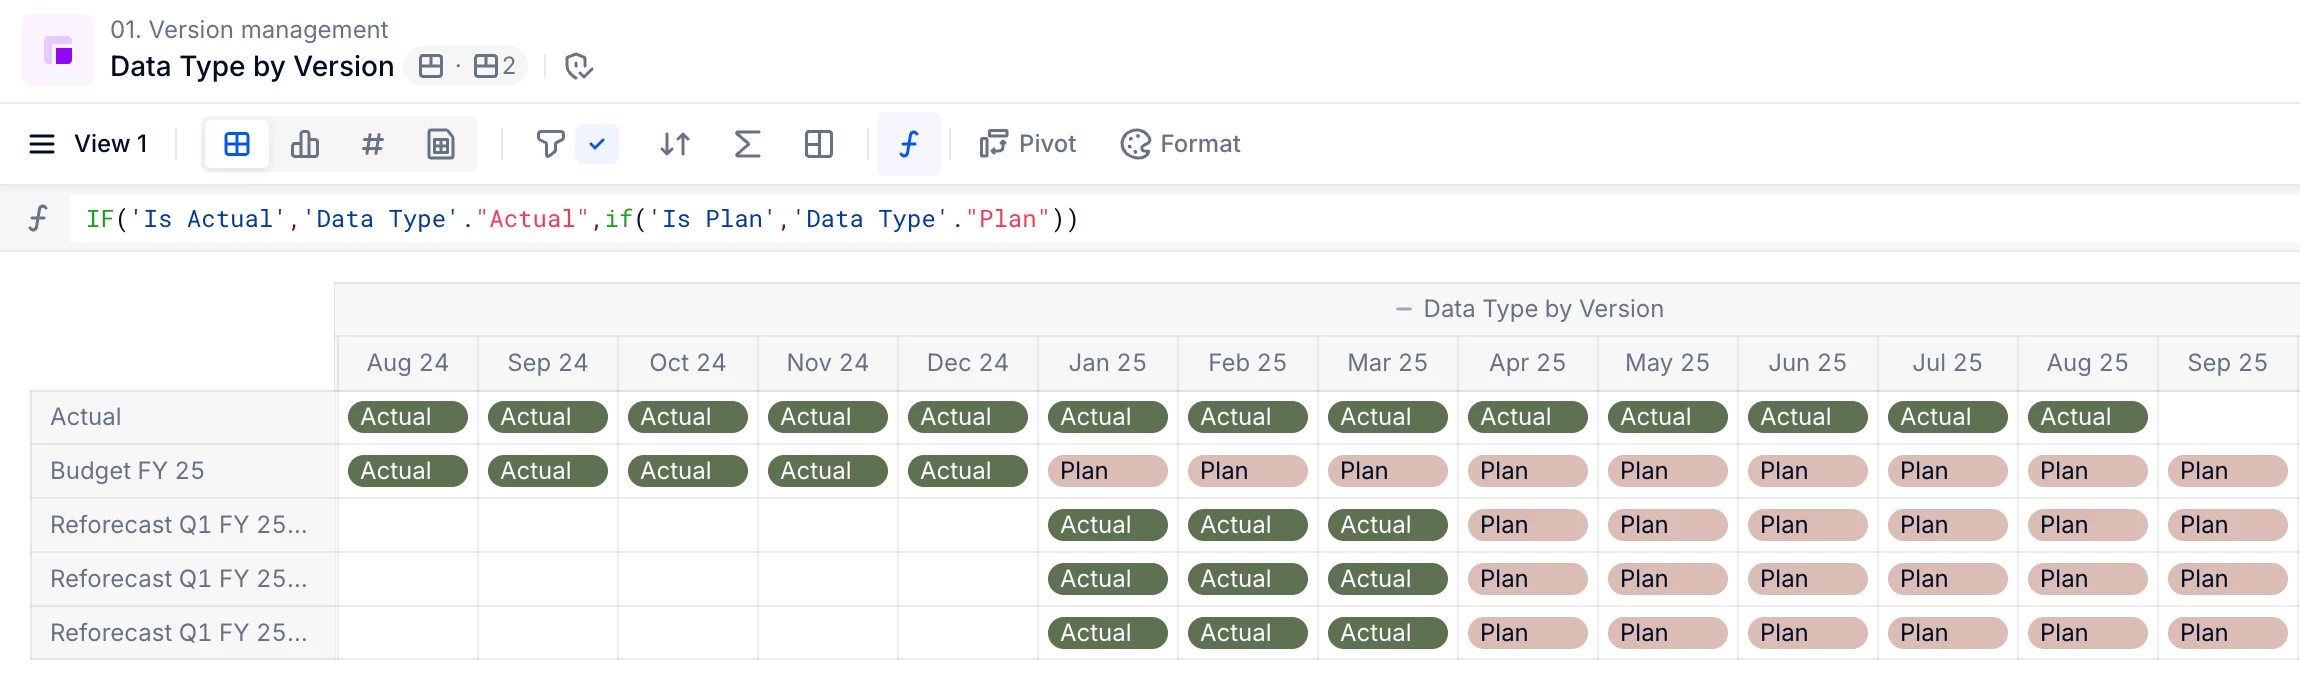
- Create a “Data Type” metric by Version
- Use this metric to display the Data Type dimension in the view using mapped dimension
Once your “Data Type” dimension has been mapped in the final Metric view, you will be able to quickly identify Actual data and Plan data.
TL;DR
✅ Best practice: Use a Version Dimension, where each item = a plan per creation year or window span (except for the Actual version, if you need one)
✅ Dimension only the relevant data blocks by Version to keep your model lean and efficient
✅ Create new plans easily by adding items to the Version Dimension
✅ Use “Clone Data” to initialise new plans from existing ones
✔️ Pros:
- Acts like any other dimension
- Full formula flexibility and user access control
- Flexibility to only dimension Metrics where it is needed
- Highly auditable
- Easy admin plan creation
⚠️ Warning:
- Each version represents a new layer of your data so the number of “Live” version should be strictly limited to what’s needed, delete the rest
- Use the “Snapshot” feature to keep any Version locked/approved that are not currently active version (like past year’s Budget)
🔑 Best Practices:
- Create early
- Use clear naming
- Add switchover month for Actuals cut-off
- Create mandatory properties in the Version dimension (start/end month, lock status)
- Build Key Version metrics (Is Actual, Is Plan, Is Forecast) that can be shared between applications
ℹ️ Note
Content in this Technical Tip also appears in a publicly available article in the Pigment product documentation: