
The Predictions tool generates customized forecasts automatically for inclusion in your model. It leverages advanced statistical and Machine Learning algorithms to analyze your historical data and make predictions about future values. You can use it for a wide range of planning needs, including demand planning, financial forecasting, or revenue projections. Use it with any time-dependent Metric in your Pigment Workspace.
What are the benefits of using Predictions?
Predictions allows you to go beyond manual inputs or traditional statistical methods, with the following benefits:
- Improved accuracy: Machine Learning models can detect more complex patterns in your data compared to manual or statistical methods.
- Use of external factors: You can incorporate external data—such as pricing, campaigns, or market indicators—and measure their actual impact on the forecast.
- No data science expertise required: The feature is designed to be simple and intuitive, so business users can run and understand Predictions without needing technical knowledge.
- Fully integrated with Pigment: Predictions runs natively within your Pigment Applications and can be seamlessly connected to your existing Metrics, and workflows.
Before you begin
How do I access Predictions?
To request activation of the feature, the Workspace Administrator or the Primary Owner must submit a Support ticket.
Access rights
Access rights are based on the permissions set on the Metric used as the source for the Prediction:
- Read access determines the data used for prediction. Forecasts are based only on the data you’re allowed to view, and any Prediction results you save are limited to that same viewable scope.
- Write access is required to save predicted results. To copy Predictions into the source Metric, you must have write access. If not, the operation fails with an error.
 Important
You need the Define Application Security permission to run Predictions.
How do I run Predictions?
-
From the Predict button:
-
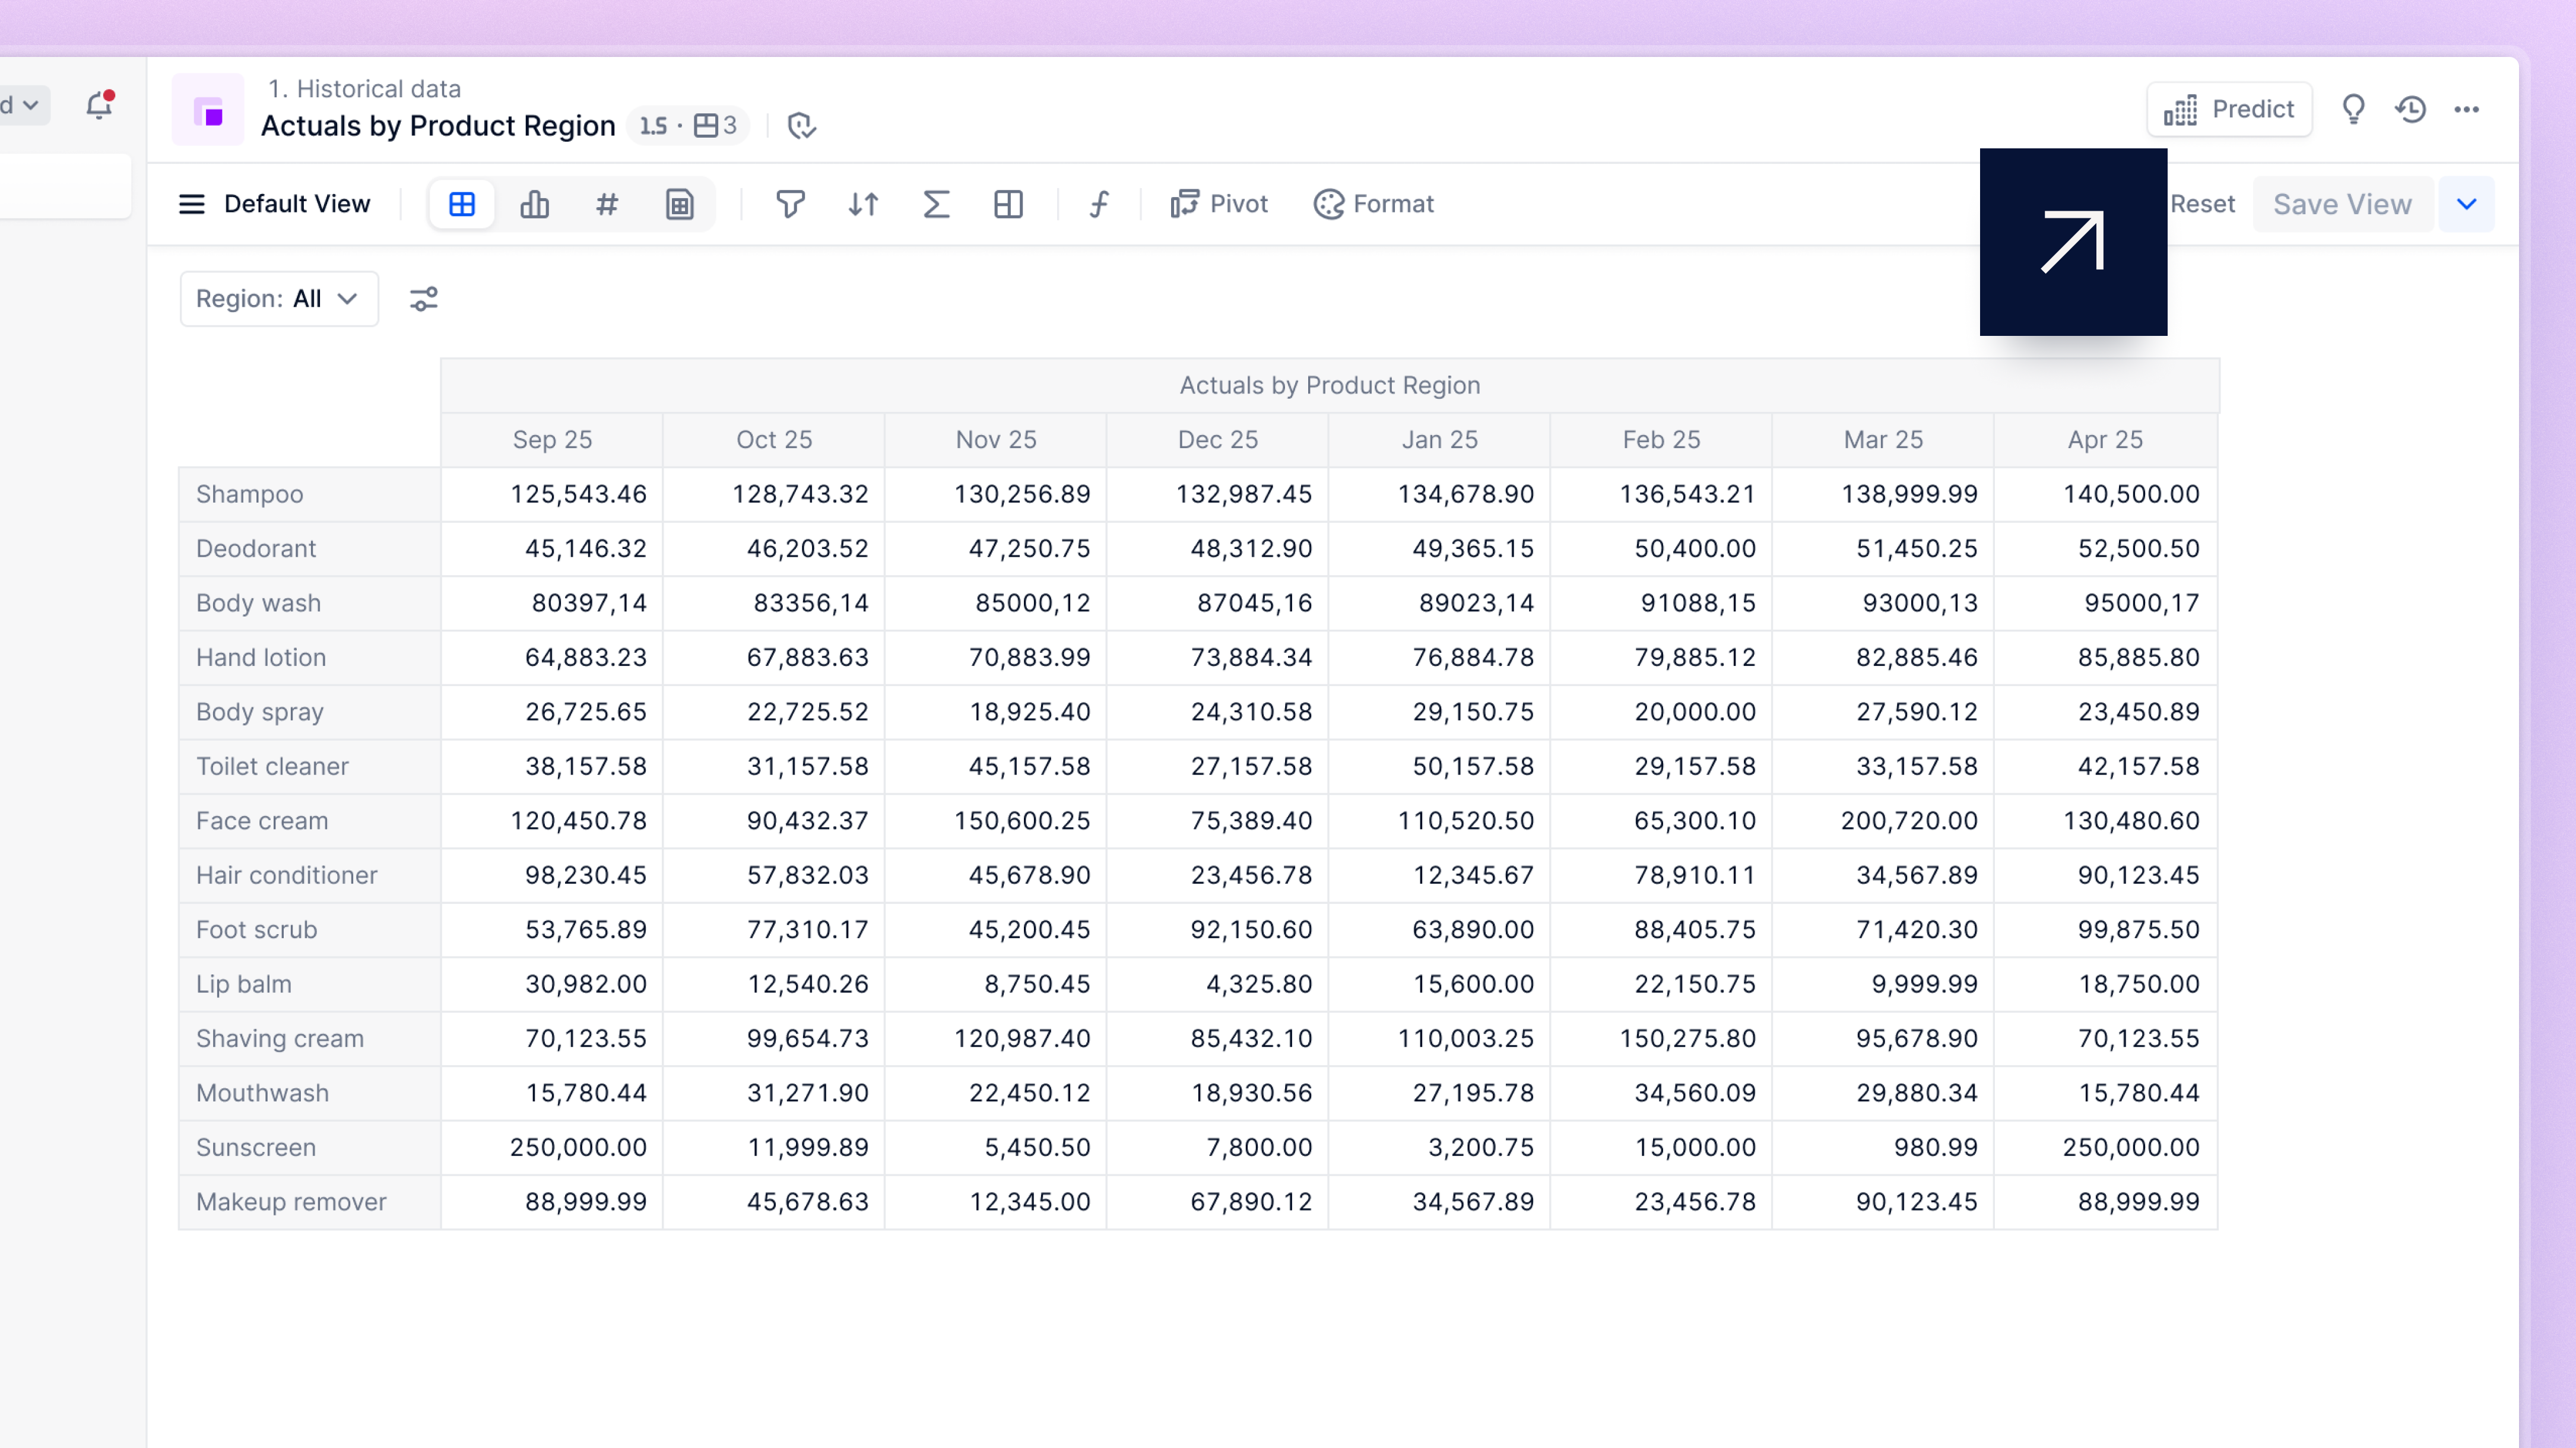
Find and select the button shown below in the top toolbar of eligible Metrics:
-
Select + New from the panel that opens on the right.
-
-
From the Application's Settings:
- In the sidebar, select the three dots at the bottom with the More options tooltip.
- Select All settings from the dialog that opens.
- Select Predictions, then Start a Prediction.
After accessing Predictions, a dialog opens with the below sections.
Define Data Source
This Metric provides the historical data you want to forecast into the future. Click in this field to bring up a dropdown of eligible Metrics. Metrics must have the following to be eligible:
- a data type of Number
- a native Calendar Dimension (
Year,Quarter,Month,Week,Day) - empty values at the end of the Calendar—the period to predict for
 Note
NoteMetrics with the
Prediction TypeDimension are ineligible.
Configure Predictions
- Define the following Settings for your Predictions:
- Predict until: the time period for which you want to predict.
- Model: the choice of algorithm used to generate predictions. See this section for more information.
- (Optional) External factors: data outside the source Metric that may influence its future values. See Use External Factors in Your Predictions for more information.
- (Optional) Calculate accuracy: toggle this to On to switch on Predictions’ accuracy measures calculator. See Understand Predictions’ Accuracy Measures for more information. Note: accuracy measures calculation doubles computation time.
- Set the following Advanced options to optimize your Predictions:
- Fill blank values with: replace missing values in the source Metric with one of the following:
- Previous non-blank: 'forward filling' for when the last known value is a reasonable estimate for the missing period, such as stable pricing or inventory levels.
- Zero: for when missing values represent no activity, such as where there are no sales during a period.
- Predict only positive values: for when the predicted Metric shouldn’t be negative, such as sales, revenue, demand. This ensures that the Prediction output only contains positive values.
- Predict only integer values: for when the predicted Metric should be whole numbers, such as units sold, headcount. This ensures that the Prediction output is rounded to the nearest integer.
- Fill blank values with: replace missing values in the source Metric with one of the following:
How Predictions works
Predictions generates time series forecasts at the most granular level available. For example, if your Metric is Sales with the Dimensions Month, Product (100 Items) and Region (10 Items), Predictions generates one data point per Product-Region combination for each Month in the forecast period. In this case, Predictions would generate forecasts for 1,000 distinct time series (100 Products × 10 Regions). Each time series is processed independently to capture its specific trends and seasonality. Sparse intersections with no data are automatically ignored.
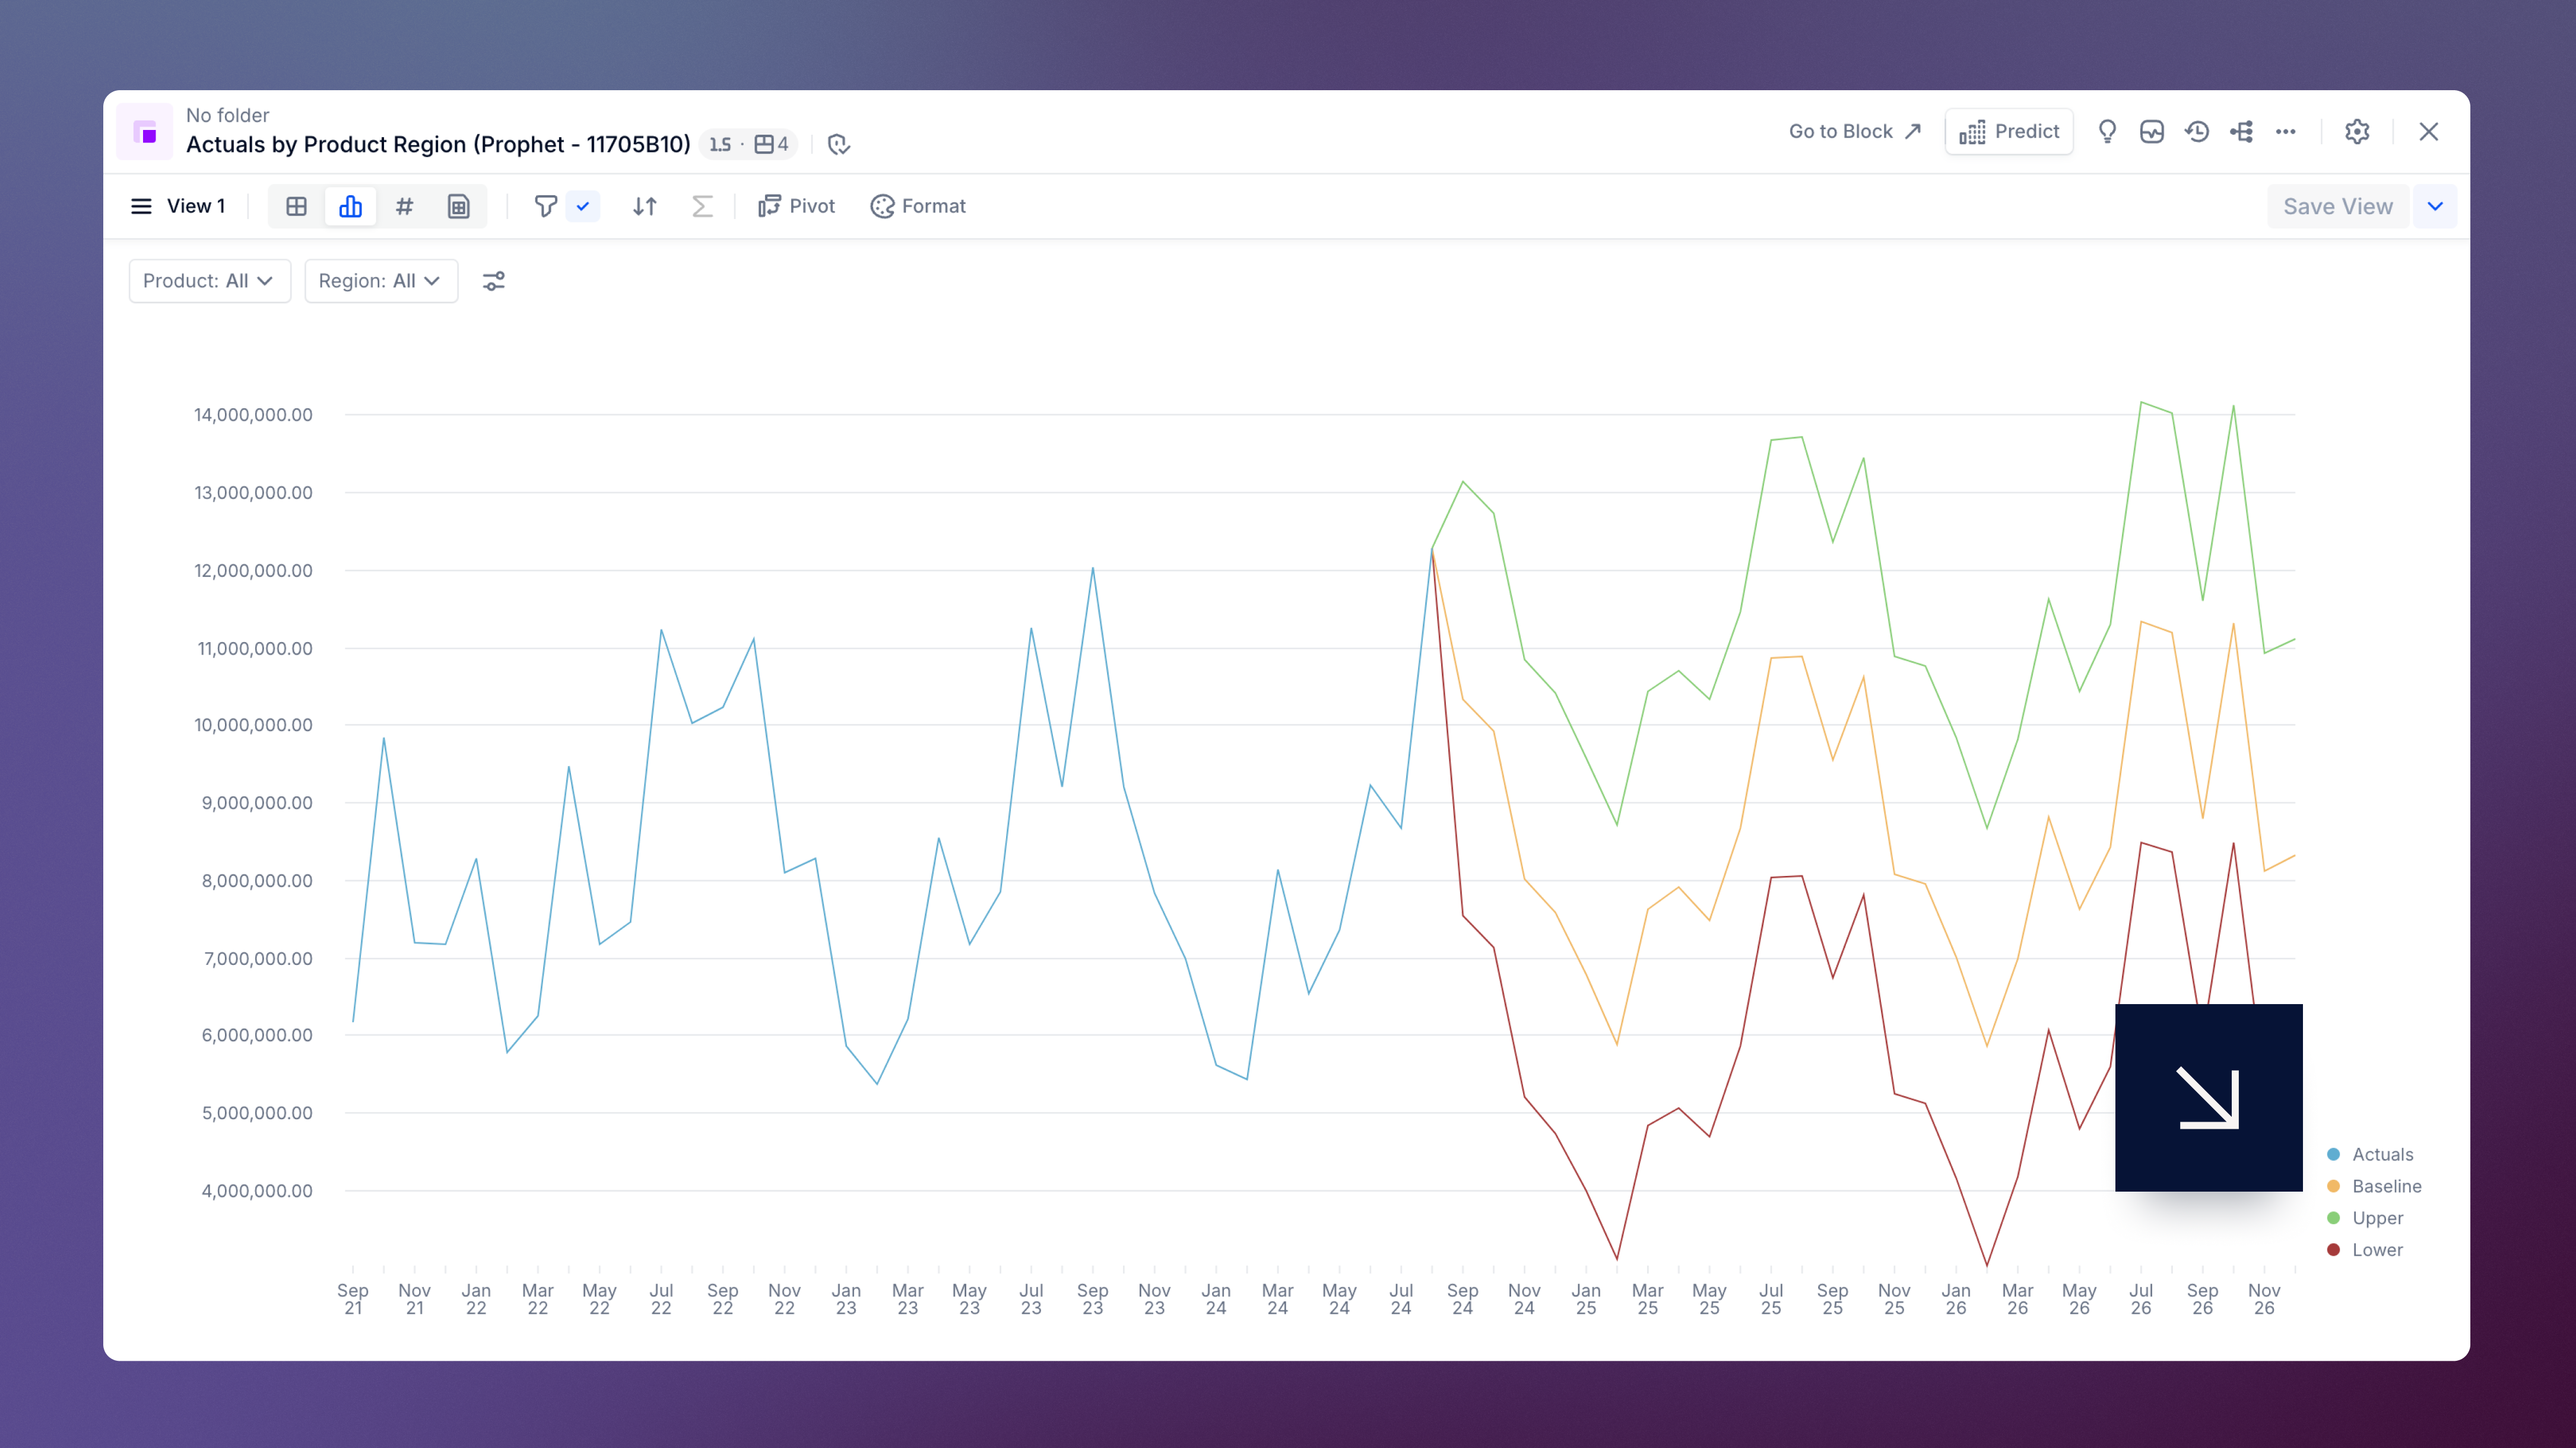
The output comprises a baseline forecast along with the upper and lower bounds of a 95% prediction interval (see image below). This is an estimate of the range in which future individual values are expected to fall and can be interpreted as: “we are 95% confident that the actual future value will fall within this range."
Predictions creates a new Metric for the results, containing the Dimensions of the input Metric and an additional Prediction Type Dimension, which includes the Items Actuals, Baseline, Upper, and Lower.
 Pigment Academy
- For a video demoing Predictions, see this Pigment Academy film.
- For insights, examples and use cases on Pigment’s AI tools, explore the Pigment AI Learning Path.
How does the Predictions quota work?
Your workspace has a Predictions quota based on your subscription plan. This quota defines the number of time series predictions you can compute each year. In the example mentioned above, the Prediction would consume 1,000 time series predictions from your quota.
Your quota is reset each year on your contract start date. You can track your quota usage in your Workspace in the Plan & Usage page in Settings. See Current Pigment License Types for more information.
Important
Only Workspace and Security Admins can view the Plan & Usage page.
Predictions that have expired or that you delete still count against your quota. Removing them does not free up quota for new Predictions. Predictions that failed do not count toward your quota.
Review and save Predictions
Predictions creates a new Metric for the results, containing the Dimensions of the input Metric and an additional Prediction Type Dimension, which includes the Items Actuals, Baseline, Upper, and Lower.
It also populates a panel on the right of the pane that summarizes the inputs and settings chosen. If you added external factors, the panel includes a report describing their contribution. See Use External Factors in your Predictions for more information.
The temporary Metric disappears after one day. Before it expires, you have the following options:
- Do nothing. It disappears after one day.
- Save it in a Metric for inclusion in your model. It becomes permanent. You can either create a new Metric or save Predictions results in an existing Metric with the same Dimensions.
- Copy and paste the results into the source Metric. The temporary prediction Metric still disappears after one day if it isn’t saved.
Manage Predictions
Open the Predictions tool through Settings (see (2) above for guidance) to manage all your Application’s Predictions. Here you can sort and filter temporary predictions by:
- creation date
- prediction model used
- source Metric used
Use the results to re-open predictions and save, copy or delete, as described above.
Best practices
To get the most accurate and reliable results from Predictions:
-
Keep your data clean and consistent: Predictions accuracy depends heavily on input quality. Check for missing values, outliers, and formatting issues before running a Prediction.
-
You need sufficient historical data: Ideally you have four years of consistent, monthly historical data at granular level for each time series. However you may be able to improve forecast accuracy with as little as two years’ data.
-
External data must be high-quality: Predictions performs best when external factors are included. This data needs to be relevant, complete and predictable. See full eligibility information here.
-
Use backtesting to evaluate models and external factors: During testing, compare the performance of different models and external variables using backtesting Metrics. In production, keep only the configurations that consistently perform best.
NoteYou can explore the “Statistical Forecasting” templates in the Template Library to see a practical example of how to run backtesting and automatically select the best-performing model. Two templates are available:
- Statistical Forecasting (Monthly Calendar): if you want to forecast at the monthly level, then aggregate results by Quarter or Year.
- Statistical Forecasting (Weekly Calendar): if you want to forecast at weekly level and then aggregate by Month, Quarter or Year.
If you do not have access to the Template Library, you can submit a support ticket to request the above-mentioned templates.
-
Predict at the right level of granularity: Make sure the Dimensions used in your source Metric reflect the level at which decisions are made (such as Product x Region).
-
Regularly review model performance: Forecasting is not one-and-done. Reassess accuracy over time and re-tune model settings or inputs as your business conditions evolve.
-
Review baseline forecasts and adjust when needed: Use Predictions as a start point and apply manual adjustments where business context or recent events aren’t reflected in the data.
Note
In cases of poor data quality, very short histories, or highly irregular behavior, choose one of Pigment’s statistical functions to assess the best approach. See Forecasting Approaches in Pigment for general guidance, or for information on each function, see the following articles:
Limitations
- Not all time series are predictable: Statistical and machine learning models might fail to accurately capture highly volatile or irregular patterns. Pigment's other forecast tools might produce better results in these cases.
- Predictions are based on historical trends: Sudden structural changes (for example, new product launches, pricing model changes, or market disruptions) are not automatically captured unless reflected in the data.
- Forecasting at high granularity increases compute time: Running predictions on a large number of Dimension combinations (for example, tens of thousands of product x region x channel intersections) can impact performance.