

Your Workspace Color Palette can be customized with up to 24 colors, ensuring visual consistency and brand alignment across charts, Dimension Items, widgets, and more.
You can use your custom Workspace Color Palette in data visualizations to:
- Reinforce brand identity and align with corporate brand guidelines.
- Color code specific trends and patterns in data trends.
- Highlight key company data in a compelling way for stakeholders.
- Improve readability in data analysis.
This article explains how to customize the Workspace color palette, where it can be used, and how to apply it effectively to enhance data visualizations.
What is the Workspace Color Palette?
The Workspace Color Palette includes up to 24 colors, all of which can be used for manual formatting of widgets on Boards, cells, and Scenarios.
 Important
The Workspace Color Palette is applied at Workspace level. Only Primary Owners, Security Admins, or Workspace Admins can adjust it.
Expanding the palette impacts how colors are applied in the Workspace.
- Main colors. Colors 1-8 are automatically applied as default colors for chart series and Dimension Items. Their position in the palette determines the order in which they are assigned. Since they play a predefined role in maintaining visual consistency, they cannot be deleted, but they can be replaced to align with your brand. Any changes made to these colors apply globally across the Workspace.
- Additional colors. Colors 9-24 expand the palette for manual formatting and can override default chart series and Dimension Item colors. Unlike the Main colors, they can be deleted or replaced as needed.
Customize the Workspace Color Palette
You can expand the palette to 24 colors, adjust existing default colors, or remove colors from the Workspace Color Palette.
Add colors to the Workspace Color Palette
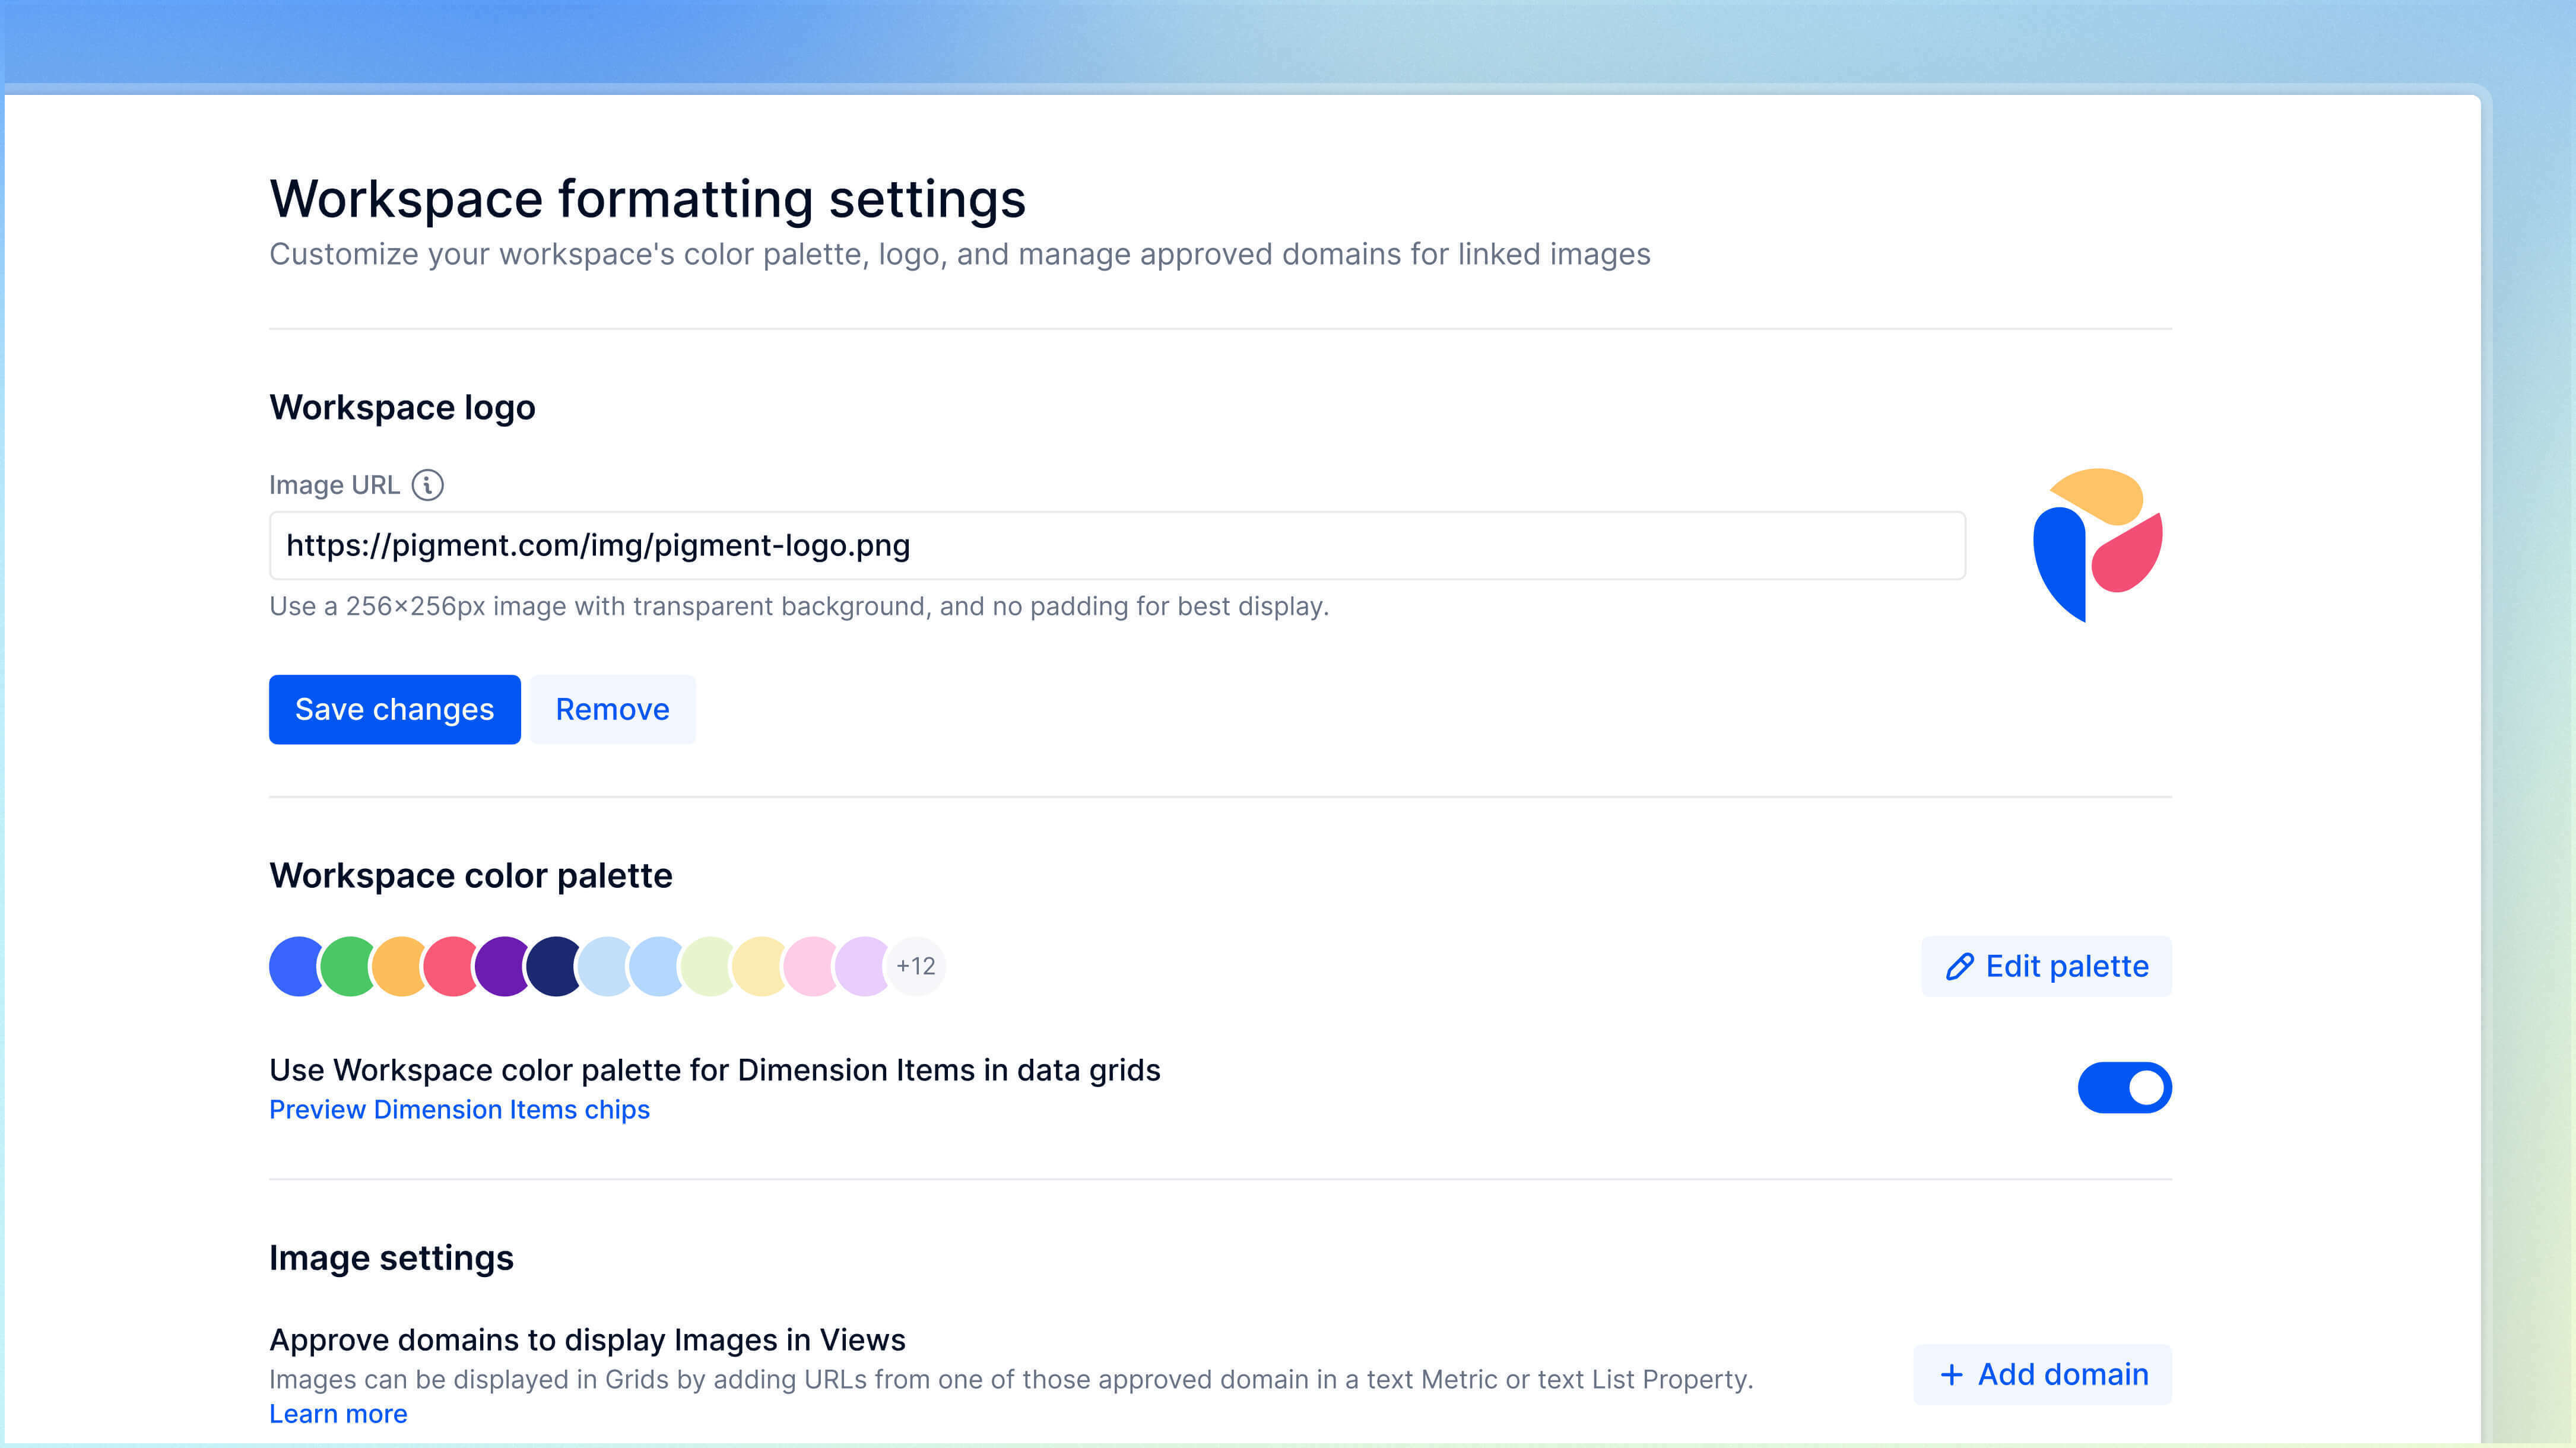
To customize the Workspace Color Palette:
- Go to Settings in the sidebar.
- Select Logo, Colors & Images.
- In the Workspace color palette section, select Edit Palette.
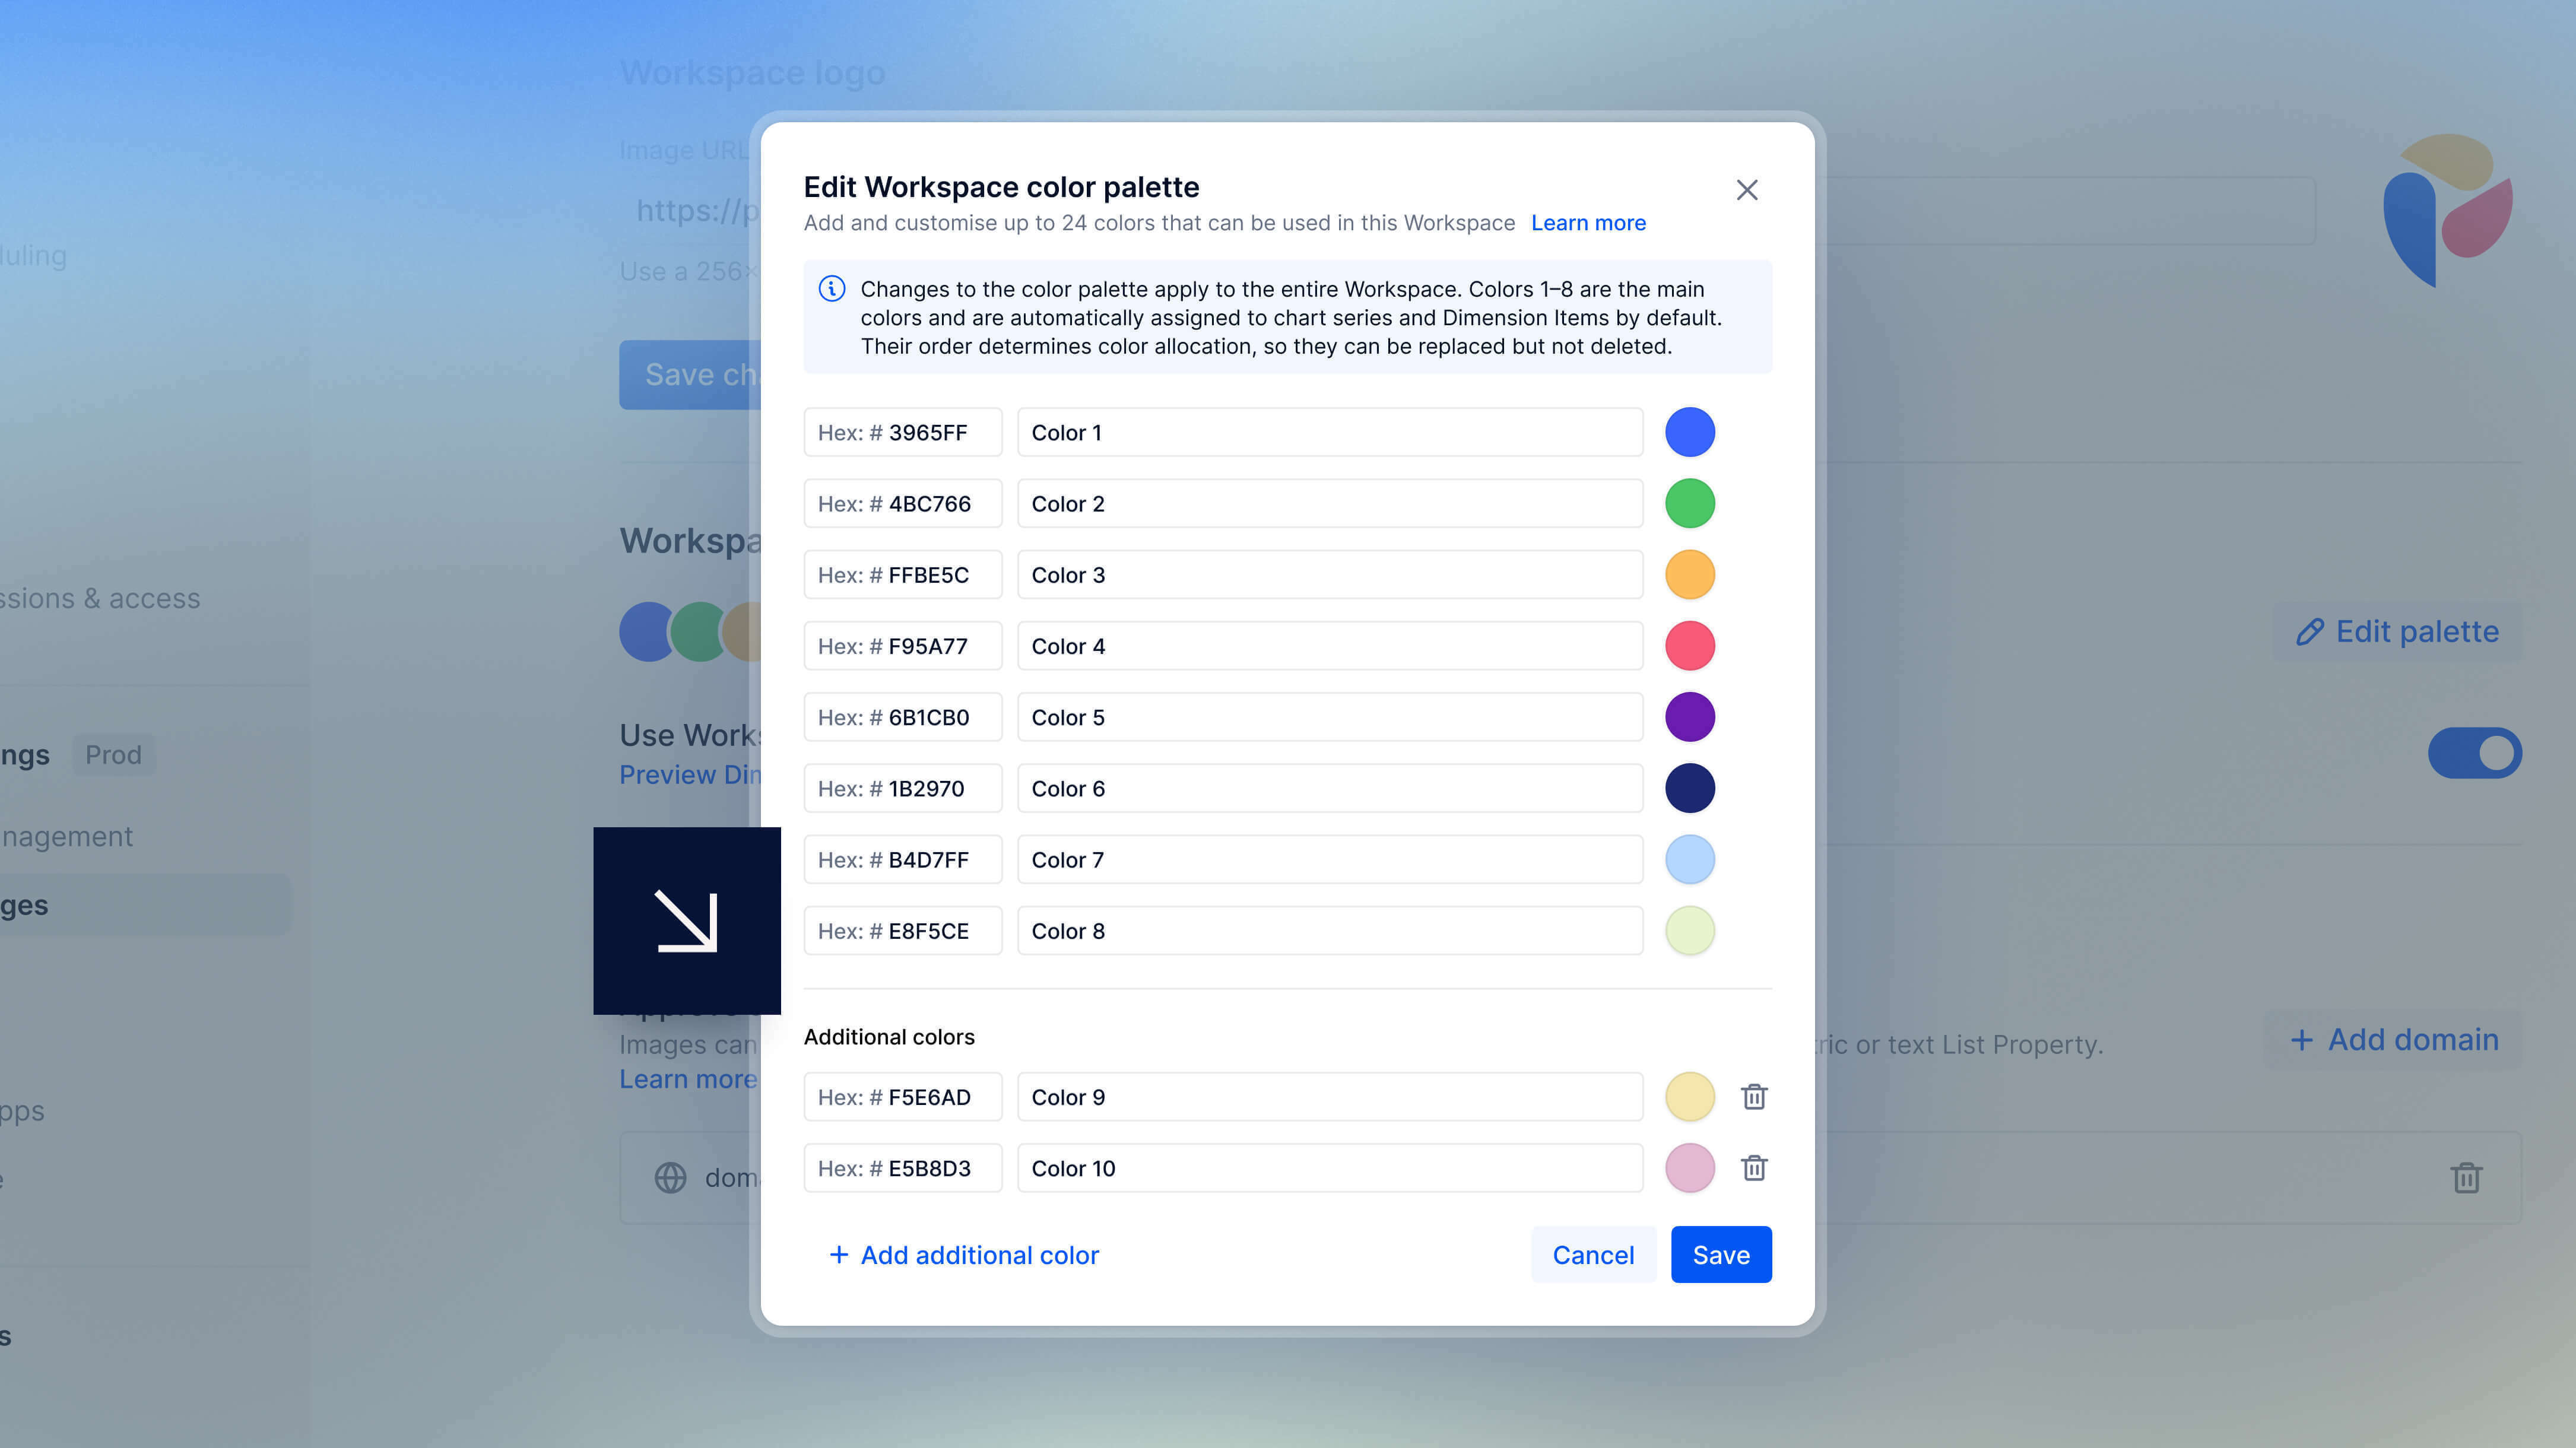
- in the Main colors section, enter a Hexadecimal (hex) code and Color name to change existing colors.
- Go to the Additional colors section, select + Add additional color and repeat step 4 to add more than eight colors.
- Select Save.
 Note
Note
Use the Google Color Picker to identify hex codes. This tool displays the color spectrum and related hex codes, making it easy to select the right color.
Remove colors from the Workspace Color Palette
The first eight colors in Color Palette cannot be removed, only replaced. Additional colors can be deleted.
To remove a color from the Additional colors section:
- Go to Settings in the sidebar.
- Select Logo, Colors & Images.
- In the Workspace color palette section, select Edit palette.
- Select the Delete symbol next to the color you want to remove.
- Select Save.
Default palette colors
The original colors in the Workspace Color Palette are:
| Color name | Hex value |
|---|---|
| Color 1 | #3965FF |
| Color 2 | #4BC766 |
| Color 3 | #FFBE5C |
| Color 4 | #F95A77 |
| Color 5 | #6B1CB0 |
| Color 6 | #1B2970 |
| Color 7 | #C2DFFA |
| Color 8 | #D0FACA |
How to apply the Workspace Color Palette
You can apply your palette to Grids, Charts, and Dimension Items for brand consistency.
Grids
The full palette can be used to customize the color formatting of cells, backgrounds and headers. For more information on formatting your data, see Format and Style Your Data in Pigment. The palette is also available for conditional formatting. For more information on conditional formatting, see Apply Conditional Formatting to Highlight Data Changes.
Important
Workspace Administrators can edit the Workspace Color Palette here. Any changes apply globally, affecting all instances where a color is used.
Charts
The default color palette is automatically applied to charts.
To select your custom Workspace Color Palette from the Color theme menu:
- Open Format in chart settings.
- Under Style, select a Color theme from the drop-down menu.
- Choose the color palette that shares the same name as your Workspace.
Colors are assigned based on their order in the Main colors list. The first color is applied to the first item in the chart, the second color to the second item, and so on. The color sequence repeats every eight items.
Edit individual Items in charts
To adjust each Item’s color in a chart:
- Open Format in chart settings.
- Under Style, select Edit beside Series colors.
- Select the color circle to view the palette and assign each Item its own individual color.
- Select anywhere outside of the palette to close it.
Your Workspace retains the order of your selection if you switch through different Color themes. For example, if you assign the first color in a palette to an Item, it remains the first color regardless of which Color theme you select.
 ️Warning
Workspace Administrators can also edit the color palette here. It’s important to remember that changes are applied to the entire Workspace. Any updates to a color will apply everywhere that color is used.
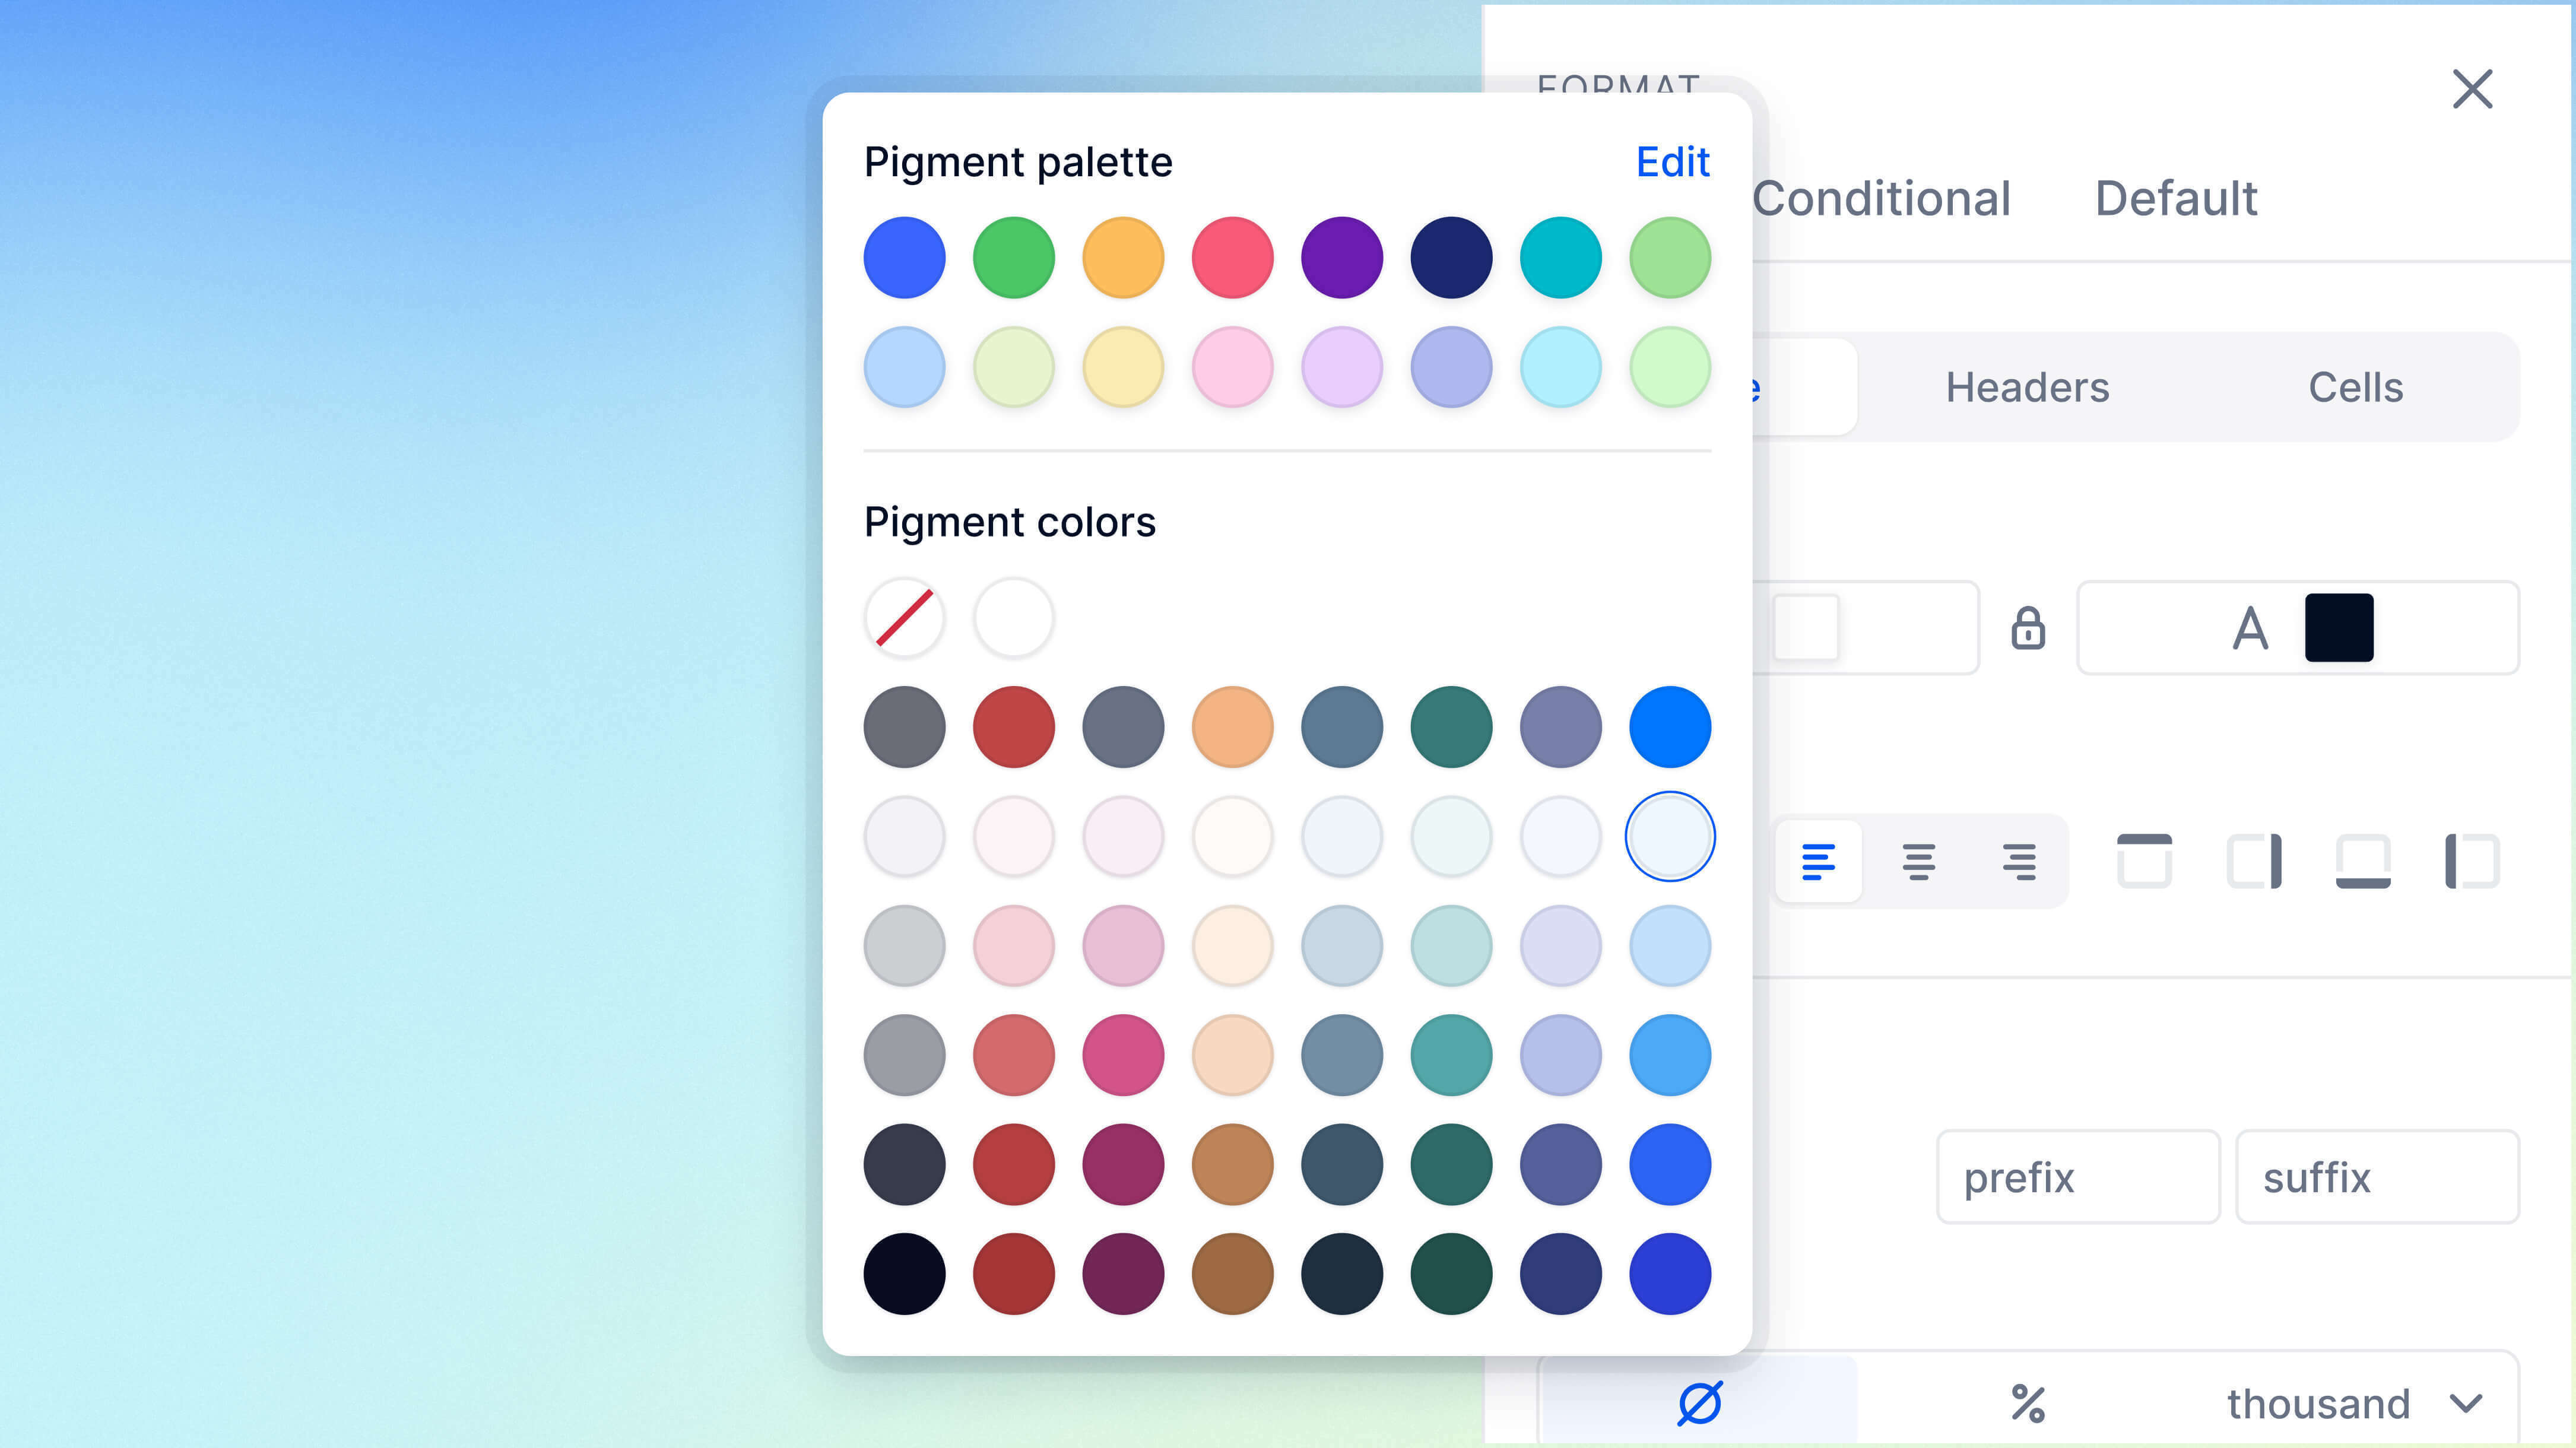
Customize Dimension chip colors and List Items
When a cell contains a Dimension data type, or when the Pivot panel displays a Dimension for a specific Metric, Items appear in colored capsules known as chips.
By default, Pigment applies predefined chip colors, but you can customize the grid by overriding them with the first eight colors from your Workspace Color Palette. When you create a new Dimension Item, a color is automatically assigned. The opacity of each chip is automatically adjusted for better readability.
Important
Only Workspace Administrators and higher can enable the Workspace Color Palette for Dimension Items in grids. This setting applies to all Applications in the Workspace once toggled on.
To apply the Workspace Color Palette to Dimension Items:
- Open Settings from an Application or your Workspace.
- Go to Logo, Colors & Images.
- Toggle Apply Workspace colors palette for Dimension Items chips to On.
Assign custom colors to Dimension List Items
When you enable your Workspace Color Palette for Dimension Items in grids, you can take your data personalization even further and apply your own choice of colors to Items within a Dimension List and values within Metrics.
For example, if a Dimension List has three states—To Do, On Hold, and Done—you can assign specific colors to each status to make them instantly recognizable.
Important
The Can Configure Blocks permission is required to assign colors to Dimension List Items.
To assign a color to a Dimension List Item:
- Open a Dimension List.
- Select Manage Items to display the Color column.
- Select any color circle to assign a Color Property, then select Continue.
- In the Color column, double-select a circle to choose a color from the palette.
- If no color is assigned, the original default color from the main Color Palette is applied.
- The assigned color updates where it is used across the Application.
- (Optional) To remove assigned colors, select Manage Items and delete the Color Property column.
Use formulas to assign colors to a Dimension
When you assign specific colors to Dimension Items, Pigment creates a Number-type Property in the Dimension List called a Display Color. This Property stores the selected color for each Item and assigns it a corresponding number from the Workspace Color Palette.
The Display Color Property functions like any other Number-type Property in Pigment. When sorting, colors are ordered based on their numerical values in ascending or descending order. Additionally, the assigned color values can be referenced in formulas for more advanced formatting.