
The Data Assistant has a number of features that help you get more from your data, including ways to save and summarize the output. It is also one of the places you can trigger Insights.
Create Views and push to a Board
Visualizations that the Data Assistant creates can be saved as Views and used in Boards:
- Enter a prompt or select a Suggested prompt.
- Select the Expand icon in the chart’s top right corner.
- Select Save View, opening a dialog.
- Fill in the fields, ensuring Public is selected under Visibility.
- Select Save.
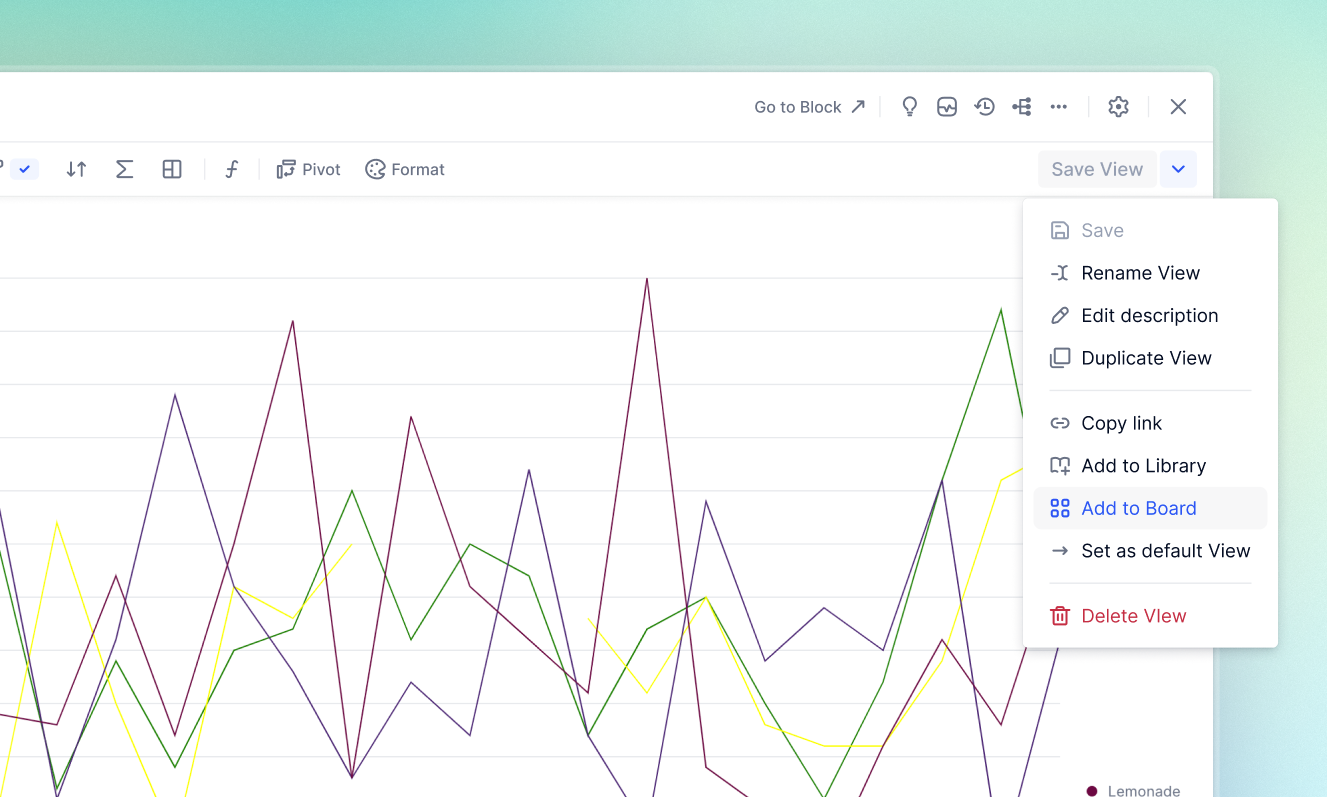
- Select the down arrow beside the Save View button (see image below).
- From the dropdown that opens, select Add to Board.
Learn more about Views here and Boards here.
Trigger Insights
The Insights feature provides automated, AI-powered data variance and contribution analysis. It identifies the Dimensions and Properties driving your KPIs and Metrics, providing visualizations and written explanations to enhance decision-making. When Insights are available, you see a Get Insights button below the Data Assistant’s response. See a full article on Insights here.
Give feedback
All responses from the Data Assistant are followed by thumbs up and thumbs down icons. Use these to flag to Pigment your reactions to the current conversation. This feedback is not used by the model but is analyzed by Pigment to see what improvements we need to make.
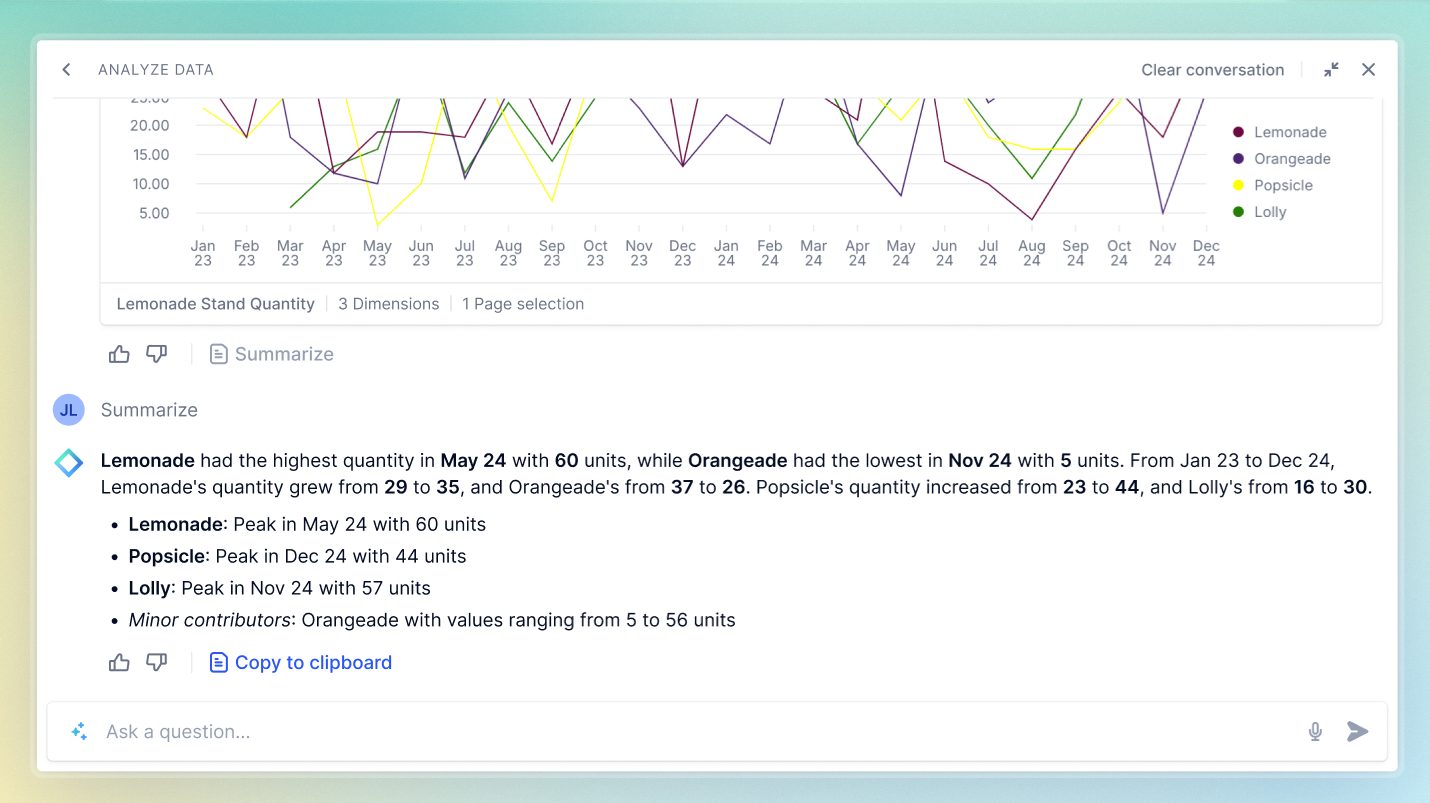
Summarize
Summarize appears beneath charts created by the Data Assistant. Selecting this brings up a description of the chart’s contents in a few sentences, as shown here:
If the Data Assistant cannot answer in full, it provides context where possible in the following situations:
- when the prompt refers to Dimensions absent from the Metrics selected for Pigment AI. For example:
I couldn’t find the Dimension “Cost Center”. - when the prompt requires functionality beyond the scope of the Data Assistant, along with a link to the Data Assistant’s scope and limitations. For example:
I couldn’t perform the action of moving ‘Country’ to columns because that is not supported.
Learn more
- How to use Insights
- What is Pigment AI?
- Configure your Workspace for the Data Assistant
- Sample Data Assistant Prompts
- Features Supported by the Data Assistant
 Pigment Academy
For detailed insights, examples and use cases on Pigment’s AI tools, explore the Pigment AI Learning Path.