Connect with other users, discuss how you're using Pigment, and get inspired
Recently active
I am trying to build a board that identifies any sales orders (within the current fiscal year) that tie back to more than one sales territory, but with a catch, since there are only 3 out of 6 territories that I care about. So, I have a data set with a whole bunch of sales order numbers and the sales territories they tie back to...hundreds of thousands of rows of data. Each row has one SO#, one sales territory and the bookings that went to it., meaning one SO could be displayed in up to 6 rows in this data set. But I only want to see the ones where a single SO ties to more than one of 3 specific territories, which should be a very small amount. But there are 6 territories that could be listed. Territories A, B and C are our geo territories that actually have salespeople assigned to them. Territories D, E and F are corp adjustments and misc territories. Any bookings tying to those generally net out to $0, but because bookings go in and then come out, the system still registers that boo
Summer is heating up, and so is Pigment. Your Agents have officially left their desks—they're now Workspace-wide! Alongside powerful AI enhancements, this July, we're introducing the AI Investment Planner, and rolling out new ways to improve collaboration, data management, and reporting. Dive into everything that's new: 🤖 Your Agents just went Workspace-wide 📁 Bulk upload files to Agents 🔄 Keep Metric data in sync 📊 Improve your chart readability 🎨 Include headers in alternating colors ⚡ Enforce access rights checks on Item deletion 👁️🗨️ Add layout options to View Templates 🔎 Debug Views faster with filter toggles 👤 Bulk Export Metrics and Lists as CSV 📦 Break down Mapped Dimensions & Data Slices ⬇️ Refine selector drop-downs with new filtering options 📈 Introducing the Pigment AI Investment Planner 👥 Upcoming User Groups & events worldwide Your Agents just went Workspace-wide Launch Pigment's Agents right from your homepage and work across multiple Applications i
I’m able to sort the items in my dimension list, but once I apply it to the page filter, the sorted order is lost. Is there a way to fix this?Thank you!
Hi Pigment Community,Is there a way to see information about data exports performed via an API export key?For imports, Pigment provides good traceability: when using an API import key, the application shows which assigned user performed the import (e.g. via the Block updates view).I’m looking for something similar on the export side:Visibility that an export was triggered via an API export key Ideally, being able to see which user the key is assigned to, or some form of audit/logging for API exportsIs this currently possible, or is there a recommended workaround?Thanks in advance!
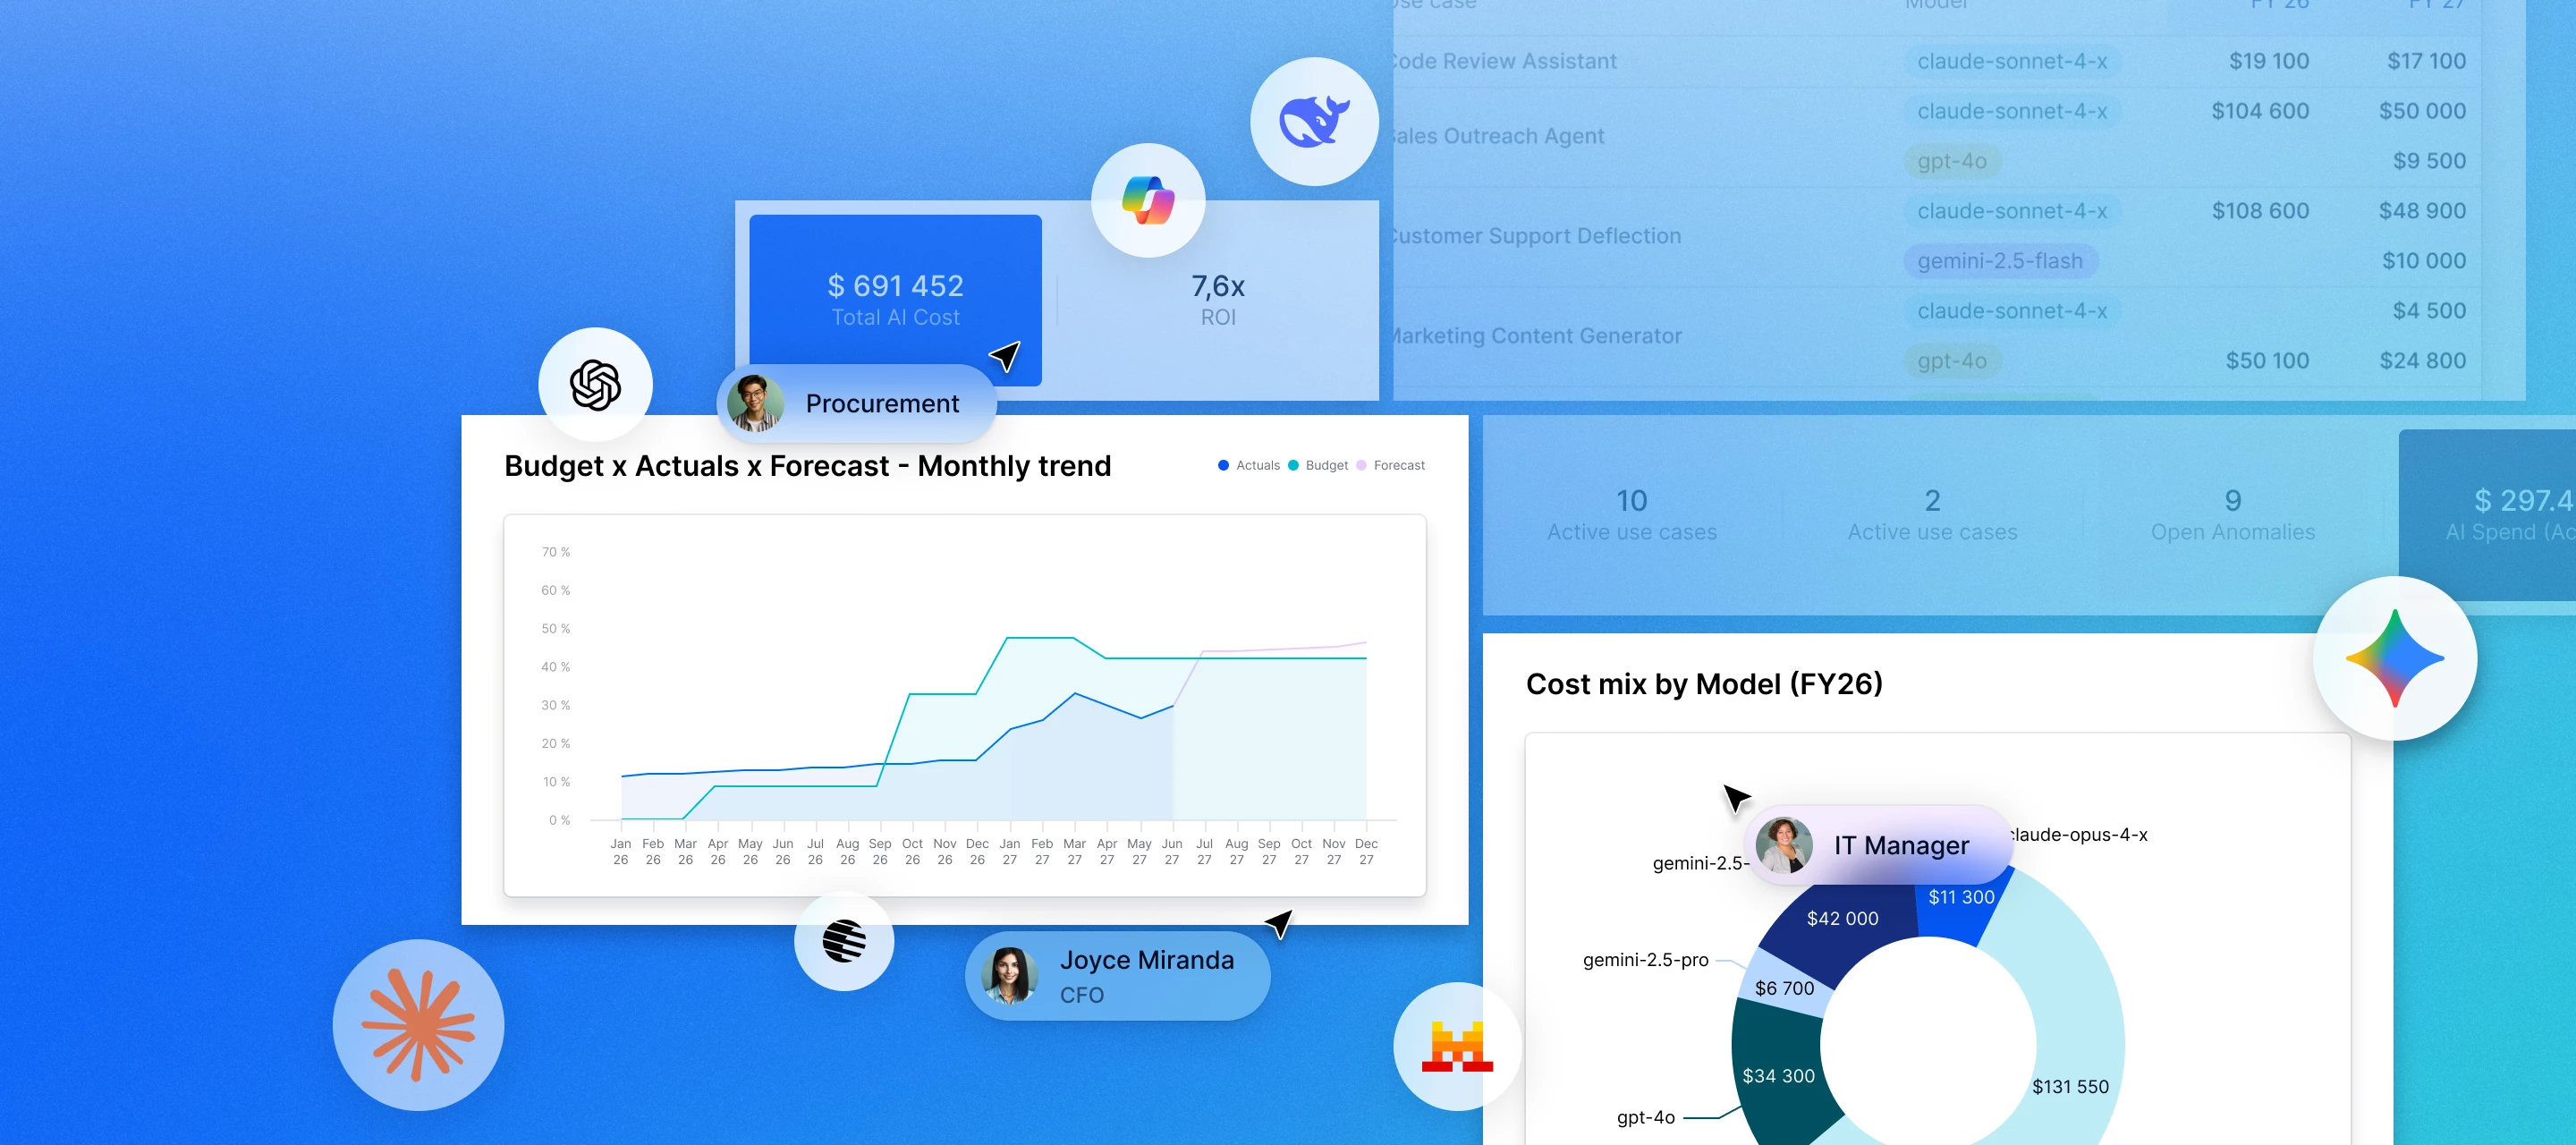
AI adoption is accelerating and so are the costs that come with it.Today, we're excited to introduce the Pigment AI Investment Planner, a new native application that gives organizations a single place to forecast, govern, and measure the ROI of AI and LLM spend, all within Pigment.With the AI Investment Planner, you can:Centralize AI spend across providers, models, and teams Forecast token consumption and costs alongside the rest of your financial plan Identify spending spikes and model drift before they become budget issues Model the ROI of your AI initiativesWe believe organizations should not have to choose between moving fast with AI and staying in control of their budget.The AI Investment Planner is available to all Pigment customers. To request access, simply reach out to your Customer Success Manager. See it in actionWant to learn more? Join our live demo to see the AI Investment Planner in action and discover how it can help you forecast and control AI spend. 👇
Hi Community, I’ve been getting this message from the modeler and it seems to be stuck in a loop,“The content previously displayed here relied on an older version of this Agent and can no longer be retrieved.” anyone ideas? Thanks
Expanding on the Version Control in Pigment | Community idea, we’d like to raise the following issue : During a planning cycle, we are required for new versions to implement changes to the structure of the application (be it new formulas with new metrics or event changes to formulas, blocks creations...) that require a new version of the application : the existing one must be kept with all existing figures, while a new one is used to bear the changes We often work on this new version with paradigm changes and are required to go back to the previous application version to change some assumptions and compare how they perform back to the newest version These different application versions are required to be kept for audit purposesAs of it is not possible to perform all this in a single application (we create a clone of the application). The idea would be to be able within the same application to be able to create a copy of the application (a bit like a snapshot), with the ability to still
Month after month, Pigmenauts share challenges, ideas, and solutions that help us all learn and grow together.To celebrate this knowledge sharing, here are July’s top 5 questions. We’re highlighting the ones that sparked the most interest and views from fellow members 💡.Whether you faced the same challenge or want to learn new tips, these threads are a great place to explore, contribute, and connect. How do I archive data within metrics? Question - @johnturner:"I'm looking for a way to keep live planning versions and static archived versions in the same application, without duplicating applications or maintaining dozens of metric-to-metric imports. What's the best approach?" Best Answer - @Stef:The recommended approach is to use Snapshots together with Slices.Unlike metric-to-metric imports, Snapshots are static by design (they can't be changed or recomputed) and Slices let users compare snapshot data with live data directly within the live application. You can also remove Versions
We are trying to use Data Slices to do variance comparisons between versions, where some versions live in the live environment, but some versions live in snapshots. We have created new metrics (formula based) in the live environment that we want to do variance on. But these metrics do not exist in the snapshots. Without functionality to be able to create / migrate these metrics into the snapshots I feel like the data slice functionality is not very useful from a snapshot perspective. It is not reasonable to assume that you’ll have every single metric ever needed created before you start taking snapshots. Is there anything being considered by product on how to solve this problem?
Hi Team,I need your help on this one. I have table with sub program dimension and there few programs which are part of a group for that i have created a property (Boolean) that filters out those programs (Boolean because more programs can be part of that group in future so easily editable).I need a feature on board where i need all sub programs on board on selector but a toggle like feature for that particular group. Just that when i click on that toggle only those programs part of a group should show on table and when i turn off/uncheck rest of program or all should be part of that group.I tried creating a metric based dynamic variable, but it comes under that dimension not separately.for eg when i edit the board and click on page selector options under sub program i see was as a group variable i.e. one item but on front end it shows all sub programs separately not under one item.Can someone tell me how can i achieve this? What am i doing wrong with my approach?Thanks in advance
Hello, I saw it’s an outstanding idea to support automated schedule send of boards/blocks. But I was wondering if in the meantime anyone has been able to create a workaround to support that? I’d like to be able to send a pdf export of a board every X day of the Month to a defined set of emailsThanks,Kristian
Hi everyone!My name is Anita and I am a Senior FP&A Manager at Trainline. The FP&A team is expanding and looking to hire a Senior Pigment Analyst. Trainline are hiring their first dedicated Pigment expert - someone to own the platform end-to-end and help build out a modern, automated FP&A function at one of Europe's leading travel tech companies.You'd be the go-to for model architecture, governance, and day-to-day platform maintenance, while also building out self-service reporting tools and automating workflows currently stuck in Excel and PowerPoint. There's real scope here - we are mid-transformation and Pigment is central to it. You would be supported by Pigment's Premium Success Plan.Based in London — hybrid, with a minimum 60% in office over a rolling 12-week period, plus a 28-day work from abroad policy.Interested? Find more details here.Any questions, feel free to message me here.
Hi guys - curious if anyone has tried to do this… I am trying to create a new scenario that is based off of a previous “snapshot” version of an application. This doesn’t show up for me as an option when choosing the “initial source of data” dropdown in the new scenario creation prompts. We use snapshot functionality to catalog our forecast versioning, so if I have a “4+6 Forecast” as a snapshot scenario from 2 months ago that we want to use as a basis for second half reforecast, I’d have to reference that dataset (not the live forecast) for our baseline/starting data. Anyone know how to accomplish this?
Hi!It would be great to create another step of the Learning Path to enable many topics not covered in the Fundamental training but present in the articles in the community, such as Variables, integrations, naming convention and etc.The next step for advanced models and enterprise cases would be of use.Could you please tell if it’s on the roadmap? Or perhaps I overlooked it and would be glad if you provide me with the link.Thanks.
Hello community, I have a dimension City, with Department/Region/Country parents. I would like to use a Conditional Formatting on a metric, probably based on another source metric, to display raw data dynamically on a specific color according to the level of granularity. But I don’t know how to create a metric which calculate the level of granularity of my dimensions. Let’s see my exemple: Dimension 1 : City Dimension 2 : Department > CityDimension 3 : Region > DepartmentDimension 4 : Country > RegionMetric : Budget per city Do you have any clue? Screenshot with fixed colors*
Welcome to our annual introductions thread!We hope you’ll use this as a place to share a little more about yourself and get to know the other members in our community. Tell us where you work, a bit about your role, where you live and how you use Pigment. Add any interesting facts about you or even a nice picture that means a lot to you (like in a cool place, or with a pet)! If you want to see our past introductions thread for some inspiration, look here. I’ll get the ball rolling:Hi! I’m Isabella - I’m the Community Manager here at Pigment and I’ve had the great privilege of working here for 2 years. Before Pigment I worked at a data science education company, and my academic background is in Mathematics and Finance.I’m originally from South Africa and moved to the UK around 4 years ago - I’m now based in lovely Harrow. Outside of work you’ll typically find me reading, gaming, traveling, going to a gig, or building a cool cosplay for Comic Con.I’m looking forward to getting to know you
Hello, I am building an app that reports on data with varying time lengths. So a user may want to see their boards either quarterly, half -yearly or yearly. Quarter, half year and yearly are all dimensions within our Pigment Datahub, and they have defined relationships between them i.e. Month → Quarter → Half year → Year are all connected to each other. Currently all three dimensions are used as selectors on my boards:But I want a user to be able to land on a “Time Period Selector” board and: Choose either the Quarterly, Half Yearly or Yearly reporting frequency The chosen dimension (conditional on what the user has selected) is then the only available selector throughout all the other boards in the report, rather than having all three dimensions available as selectorsI have mocked up a “Period Selector” board to show what I am looking for. It uses a dummy dimension called “Time View” which has the list items Quarterly, Half-Yearly and Annually, it is not currently connected to the Qu
Hi - could someone please share some best practices for setting up waterfall charts?I’m trying to create a bridge: Starting Headcount, New Hires, Terminations, Ending HeadcountQuestion 1: does the formula in Ending Headcount have to be “Starting Headcount + New Hires + Terminations”? It seems like yes if I want to create a Contribution Waterfall Chart. In this scenario I’d have to create an Iterative Calculation and use the “PreviousOf” function for the starting headcount, right? Or is there a better way?Question 2: Is there a way to make the periods that are shown in the chart dynamic based on the page selectors? We’d like our users to be able to select which months to see. For example, if they select June and September, they should see a waterfall with June Starting Headcount, all New Hires and Terminations for June/July/August/September, and then Ending Headcount for September. Is this possible?Question 3: is there a reason I can’t control the Aggregator Settings in the chart? This
Hi there, I haven’t really found something related to this topic, hence this new one. I am fairly new to Pigment and have been working heavily with other planning solutions so far. What I see in every project is the need to easily set up parent-child hierarchies for cost centers, profit centers or products. Those can have many levels (e.g. a 10 level deep cost center hierarchy). In other solutions I would get all node and leaf items from a source system and add the respective parent in a separate hierarchy column (so I need to keep two columns maintained to have a full multi-level hierarchy). What is the equivalent of this in Pigment? Thanks everyone! *Update: my apologies, I was actually referring to parent child hierarchies. Would that change the approach?
It looks like all users are able to see all other users’ inputs in metrics dimensioned by the User list. Is there a way to restrict this? The typical access rights flow doesn’t seem to allow this
Hi community,I'm building a monthly P&L view on a Table block and I'm trying to achieve the following layout: The user selects one month (e.g. Dec 25) via a page selector, and the view dynamically shows:- The value for that month- The value for the same month prior year (Dec 24)- The absolute variance (CY − LY)- The % variance ((CY − LY) / LY)What I've tried:- Calculated items with offset -12** on the Month column pivot — works great when Month is on Columns, but breaks when Month is on Pages (the page selector filters out the offset month)My question: Is there a native Pigment way to keep a single-month page selector and still show dynamic LY + variance columns? Thanks in advance!
Hi there, I would like to show Revenue by Customer by Month in a Table. Customer should be displayed as Account ID (property of Customer) and I would like to also show Account Name of Customer. Currently I am struggling to get both. I can select just one property so it is either Account ID that is being displayed or Account Name. Is there an option to show both?
The latest Pigment updates this June are all about clarity and connectivity. Gain more confidence in your formulas, make charts easier to interpret, bring in more external data, and empower Agents with new ways to find answers and take action. 🌐 Watch the Q2 Product Release Webinar On Demand 🤖 Preview formulas before Modeler applies them 🔗 Bring your full Ashby pipeline into Pigment 👉 Reveal SELECT transformations in formulas 🔎 Compare View versions with last edited time 👤 Make charts clearer with high-contrast labels ⚡ Restore Metric data with Recovered Applications 🌈 Master your data with the new Pigment Views series 🕸️ Add the power of the web to Agents 📊 Import Snapshot data with List-to-List imports 🎙️ Meet the minds behind the numbers Watch the Q2 Product Release Webinar On Demand Missed our latest product release webinar? Watch the recording to see new Agentic Planning capabilities, UX and reporting enhancements, and Test & Deploy updates in action. Discover the
Hi, I have to build below requirement in Pigment.I want my table to display the difference between two combinations.Is this view achievable in pigment?
Hello,I would like to schedule/automate the refresh of Pigment data in my Excel using the add-in, is there a callable function I can use in VBA to do this? Any ways that people have automated the refresh I would love to hear about.Thanks, Will
Already have an account? Login
Single Sign-On Need help?
Enter your E-mail address. We'll send you an e-mail with instructions to reset your password.