Connect with other users, discuss how you're using Pigment, and get inspired
Recently active
First, thank you Pigment team for listening to users’ feedback and create this new aggregator,However when trying this out I have some questions:For example I have this metric called Revenue per Volume (Total Revenue / Total Volume), but when I use Advanced Aggregator I can not select this specific metric, the Metric A and Metric B options show all other metrics except this Revenue per Volume,So, for this to work out, I need to add both Revenue metric and Volume metric, then setting these as Metric A and Metric B for my aggregator ? This sounds like duplicated works since I already have my Revenue per Volume metric built. Can you help me clarify my question here? Thank you!
This is related to Page selectors. I have observed that “Select all” is missing in cases where the members in a list are less and this option is available when there are more members available. Is there a way to enable “Select all” on all page selectors irrespective of the number of members they contain?1. No select all Select all present
When building Org Charts, I have observed inconsistencies in formatting. If I format my metrics as Rich Text, and apply bold or italics formatting, it will not show such in Org Chart Tiles, but if I click on a tile and see the same in expanded form, it shows proper formatting.Similarly, I also want to show ‘0’ as “-”. I applied this using ‘zero display’ formatting setting to ‘-’. It changes so in table view but as soon as we shift to org chart view, it doesn’t show it. Moreover, in table view in gets rid of any prefix applied. Prefix are required when showing any property or value. So, I want that I can change blanks or zeroes to “-” and have prefixes intact within the org chart. Currently I have achieved this using text metrics, but would be better, if I can directly format number metrics for an org chartDo these inconsistencies stem from limitations within the tool, or is there a more appropriate way to apply the formatting?
I am working on a BvA board and we need a placeholder (dimensioned text) to let the users come and drop there notes there. The catch here is only this text box has to be an editable field for them and rest of it has to be read only.
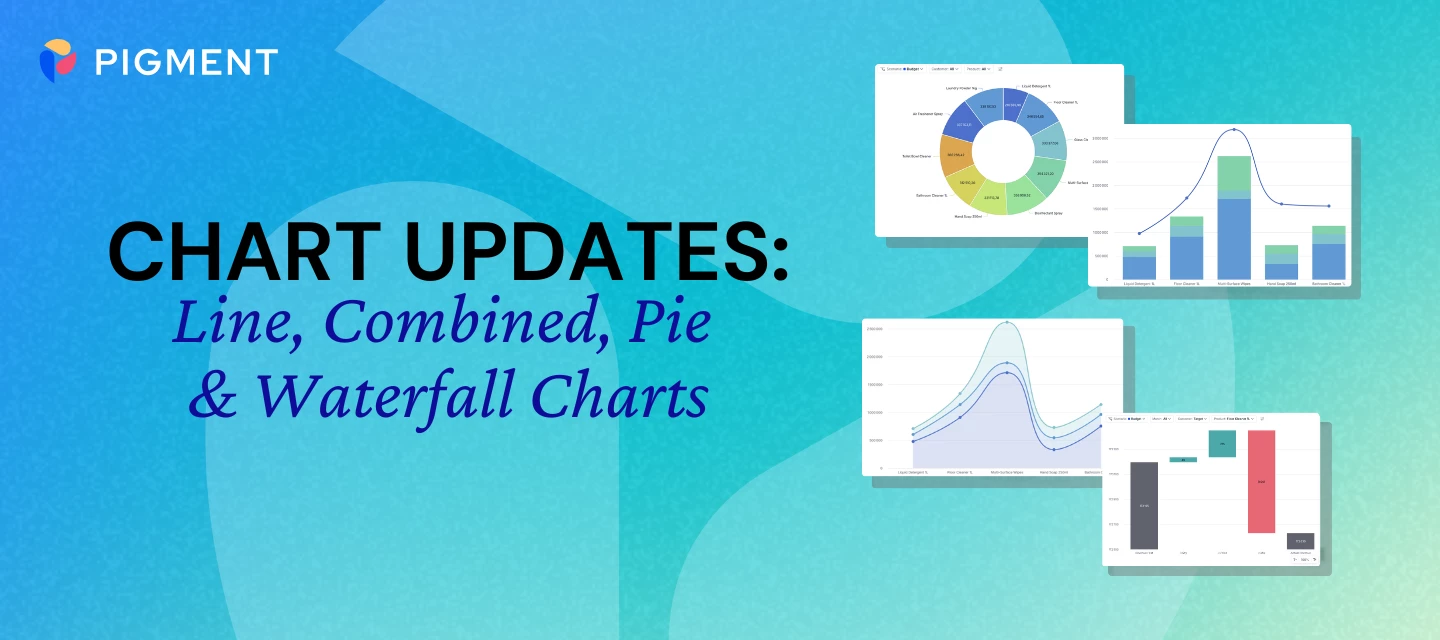
We’re continuing to roll out improvements to charts in Pigment, this time focusing on Line, Combined, Pie, and Waterfall charts.These updates are designed to make charts clearer, more readable, and easier to explore, especially when working with more complex datasets. What’s New?We’ve made a series of updates to improve your experience with Line, Combined, Pie, and Waterfall charts:Improved Readability: Cleaner spacing improves label and legend visibility, while clearer area rendering in stacked Line charts prevents overlap. Pie chart labels are also easier to read, making it simpler to interpret insights at a glance.Clearer Chart Visuals: Intuitive Tooltips: Hover anywhere along the chart to see all values at a given point in time, with no need to target individual data points. Scrollable Legends: No more lost information! Legends containing long lists are now scrollable, ensuring every item remains accessible. Left-Aligned Color Markers: To make identifying series easier, color mar
Hi All,Could you please help me solution for this use case:Use case: I have a list of Communities with Multiple List formatted properties having User List as dimension. These are to map Community managers, Regional Managers and so on. Now on a board I have this grid with Communities on rows. I want to add a regional director and community manager filter on pages in such a manner that when I select a Regional Manager, I can only see the community managers that roll up to it and when I select a community manager then I only see the communities for that community manager.Issue: Once I add a property from Community list which is User List formatted, I can’t add another property with the same dimensionSolutions I have already tried: I created a separate Regional Director List with all users with that role within the application. Then I created a metric to Identify all community managers that roll up to that regional manager against the respective communities they have access to. End result
Hi,I come from a modelling background in which we are encouraged to find alternatives to nested IF formulas. I am also close to finishing the Pro Basic online training in which we are asked to copy a nested IF formula to assign a ‘Request Status’ to changes in ‘to be hired’ items in a workforce planning model. The formula contains 4 IF functions in which various criteria is assessed in order to assign status. My observation is that would it be more efficient to create individual metrics for each status, build a formula to assign an outcome to a single item subset of the ‘Status Request’ dimension and then consolidate each individual metric into a final metric containing the full list. Then lookup this source metric in the target metric. This no doubt involves more steps but feels like it would intuitively be more efficient in spite of the additional blocks. Would love to hear thoughts from others.
Is there a way to restrict users from creating new items in a list-formatted dropdown? Basically I would like to block this functionality:From what I’ve read it seems you can restrict Users’ ability to do this across the entire app, but I haven’t been able to find a way to restrict this on a list-by-list basis. There are some instances in this app where they do need the ability to create new list items, just not in this particular instance.
What a year. First, a genuine thank you to everyone who took the time to submit an application for the Pigment Awards 2025. We received more entries than ever before, and the quality was something else. The level of thought, ambition, and real business impact behind these projects stood out immediately. Reading through your submissions, one thing was clear: teams are not just using Pigment, they’re reshaping how planning happens inside their organisations. Faster decisions, clearer alignment, smarter processes. It’s exciting to see. Our judges had their work cut out for them. Narrowing down a shortlist across so many strong transformation stories was no small task… and choosing the winners pushed that challenge even further. So first, congratulations to everyone who made the shortlist. That alone is a serious achievement. If you’re on it, take a moment to celebrate, whether that’s with your team internally or by sharing it more widely. And now, to our winners:🏆 The Bar Raiser Award —
How can I create a formula which will calculate per unit calcs correctly along all levels of a hierarchy. For example if at the top of the Product hierarchy calc Sales for all products/ Units for all products. It looks like Pigment adds the sum of all Sales/Units prices.
I think the Model Builder wrote formula into blank metric which was created for a different purpose.Is this a known issue? Can Pigment recommend a method for me to ‘protect’ a metric from reuse? I guess I could have caught it when the agent asked approval, but I had about 20 metrics being created and I must have been on auto pilot clicking Approve as they popped up in the dialog.
Hello, Currently I have my sales forecast by SKU and Month. I added to it, the “Switchover date” from Actuals to forecast to have some versioning. Now, I want to import this metrics to another metrics to only have the final version of the sales forecast for each “Switchover date”. However, we I try to import the forecast for a new “Switchover date”, it only update the values and do not create a new version for the new “Switchover date”. So, how could I create each time a new forecast when the “switchover date” changes? Thanks for your help!Ben
Hi everyone,Has anyone come across the need to sum data across different slices?We have three separate entities, each forecasting under a different scenario (as shown in the table above). We’d like to sum these three combinations together, but we haven’t been able to do this using the Sum function on the View/Board or Add Calculated Items (as it only allows adding two items instead of three)Would really appreciate any advice if you’ve solved something similar.CheersNeo
Hello,I am preparing input metrics to be filled in by the sales reps for the forecast.In the process they must allocate the “Fit Option” based on percentages by Model.However, for the model “A4”, “B4” and “C4” they can only fill in the “Fit option” “A “or “B” and for Model “D4” and “E4” it is always “3”.So, I was wondering if there is a way to:Only show A and B for Model A4, B4 and C4 and 3 for D4 and E4? Can I automatically fill in 100% for model D4 and E4 option “3”? Is there a way to highlight that each subtotal by model should be equal to 100%?Thanks for your help!Ben
Good afternoon,Is there a way to exclude ‘old’ months from the available items in page selectors? Currently I have a P&L that uses a dynamic variable (‘latest month’) as a source for the YTD calculation in a calculated column. Users can change the value of this variable in their sessions. Like so: I have my month dimension in the page selector and set the default as the dynamic variable so that the P&L is automatically filtered on the latest month. But the ‘problem’ now is that the visible page selector shows all the available months but I want to limit this to only the last year and current year only. Is there a way to limit the page selector options to only the recent months while keeping the dynamic variable for the YTD calculation intact?
Does Pigment support scoping an MCP API key to specific applications, instead of to the entire workspace? I understand that MCP only has access to AI enabled metrics, but some apps I want enabled for MCP and others just for native Pigment AI functions.
Hello, I'm still pretty new to Pigment and I'm creating some BvA reporting. I'm trying to figure out how to do the below:Show YTD calcs that aligns with the months we have actuals for. In this case, we have actuals for Jan and Feb, so I'd like the YTD calcs to be for Actuals, Budget and the Variance. Actuals and Budget are versions and Variance is a calculated item. Have a view that shows the latest actuals month and YTD calcs in the same table. Ideally it would be Actuals, Budget and Variance for Feb and Actuals, Budget and Variance for YTD. We probably need a view that includes all the trailing months broken out but I'd like to start with the above if possible.Thank you!
Hi community,I built an org chart by project where one project has multiple people, and each person has an associated cost. When aggregating to the project level, I would expect to see the sum of the costs, but instead it shows FirstNonBlank, and there is no option to change this.In the grid view, the costs are summed correctly, but in the Org Chart, they are not.I’ve attached a screenshot for reference.Does anyone know if this can be fixed, or if this is a bug?Thanks!
When typing in a date as an input (i.e. a SKU ship date), currently you must include leading 0s (i.e. 01/01/2026). We would benefit from having the data input like Excel where you can simply type 1/1/2026 without the leading 0s.
I have a metric with Budgeted Headcount at monthly level. I want to achieve the same metric at yearly level but the headcount at yearly level needs to be the headcount as of the last month of the year and not a summary of all months. Need help with the logic to achieve it.
Is there a trick to creating a blank row metric I can use as a spacer inside a grid or table. I am unable to save a metric with a space or special character as it’s name. Is there a way to hide the row header name?
Hello! Is it possible to sort the view dynamically such that the Month would automatically change to the current month?
I have a large transaction list that I sync in from Snowflake each day automatically. Today, I made a change and happened to start the new manual import configuration before the prior automatic one had finished. Pigment shows 2 imports running for the same list. Is there a way to halt an import in progress in this situation? The two running at the same time is significantly slower and in the future it would be nice to avoid this. It would be nice to have a page in the app settings that shows imports in progress (may exist, but I haven’t found it) and gives the ability to halt a job in progress.
I would like to write a formula where the intent is for the metric to calculate the average of the prior 3 months of the metric itself.I envisioned the syntax being something like the following, though it says MOVINGAVERAGE doesn’t support recursive mode.MOVINGAVERAGE(PREVIOUS(month),3)I understand that I could use MOVINGAVERAGE without PREVIOUS if the object being averaged was a separate metric, but the use case I have requires the formula to reference metric itself. Is there any solution or workaround for this?
In the When to Use the Different Types of Widgets on Boards, this caption caught my attentionBEST PRACTICE“Only add Lists to Boards that Administrators and Modelers can access to avoid unplanned changes to your data structure.”Does this mean that if we publish Lists to Boards, anyone that can access the board can modify the data ?Or can we prevent Lists to be changed in the application ?“Use or Add Lists that ONLY Administrators and Modelers can access to avoid unplanned changes to your data structure.”
Already have an account? Login
Single Sign-On Need help?
Enter your E-mail address. We'll send you an e-mail with instructions to reset your password.