Connect with other users, discuss how you're using Pigment, and get inspired
Recently active
Month after month, Pigmenauts share challenges, ideas, and solutions that help us all learn and grow together.To celebrate this knowledge sharing, here are January’s top 5 questions. We’re highlighting the ones that sparked the most interest and views from fellow members 💡.Whether you faced the same challenge or want to learn new tips, these threads are a great place to explore, contribute, and connect. Referencing a source metric containing when target contains a subset Question - @Chris Heathcote:“I have a target metric containing a subset. This dimension is a subset of a list present in a source metric. When I reference the source metric the data does not allocate over the subset list items as I would expect. Do I need to map the complete list into the subset?” Best Answer (self-answer) - @Chris Heathcote:Subsets and parent lists are treated as separate dimensions in Pigment, so values don’t automatically remap between them when used in formulas.To reference data correctly, subs
Hi Everybody,We have very detailed bottoms up forecasting for workforce planning, S&M and G&A budgeting but are scoping new ideas to calculate R&D ROI. How does your team or company think about efficiency and revenue impacts from non direct teams such as Engineering and Product?
Hello,I have a (probably) pretty easy question, but I can't quite figure it out. I have a couple of use cases where I need to allocate a value from a parent dimension (say: month) to the last dimension item of the child dimension (say: week). So in the case below I need to allocate 100 to week 48 2026 from the parent month dimension. I did use a workaround using a ‘last week’ property (1's and 0's) in the week dimension and multiplying by that. But I feel like there should be a better solution available. Can somebody help me out? :-) Thanks!Bas
Essentially, I want to skip the months of November and December when creating an offset. I’m offsetting the ‘Last Actuals Month’ by 6 to generate a 6 month lookback window and I’m struggling to find a way to get Pigment to recognize and skipover the months of November and December in that window. Example: If my Last Actuals Month is set to April 25, I would want my output to be August 25 instead of October 25 I got something like this to output: which is almost working but I don’t need Month of Year in the end structure and I can’t just uniformly remove it since in the screenshot, it’s only working properly if I was to remove December for the ‘Workforce’ scenario. Is there a way I can index a 10-month calendar and use that in the shift instead of a blanket ‘-6’? Has anyone faced an issue like this?
Hello, I’m trying to calculate YoY % in Pigment. Based on the data in the attached file, the Total YoY % is currently calculated using aggregated values. Is there a way to calculate YoY % at the lowest dimensional level and have the Total reflect that base-level calculation instead of recalculating from aggregated totals?
There is a workspace with 5 apps , all of the 5 apps are managed by T&D.Ques: For a dimension list namely “customers” in App A1.1 , can anyone please let me know why the “Disconnect Items” button is disabled?Requirement: In App 1.1: I need to mark some of the lists as disconnected and some as connected
Have you and your team made incredible progress with Pigment in 2025?Now's your chance to shine and tell us about it! Submissions to the 2025 Pigment Awards will be closing on January 31st, 2026.Whether you’re polishing your entry or just getting started, you've got 2 weeks left to shoot your shot at an award that celebrates individual or team achievements for the inspiring work you’re doing with Pigment.On top of bragging rights, us shining a light on your work, a personalized trophy and $200 gift for all winners, you can also earn $50 worth of Points in our Customer Advocacy Program simply for submitting your application.🏆 Join us in celebrating excellence across the Pigment community! 👉 Apply here 👈
Hello everyone!Adyen is looking for an FP&A Solutions Analyst to join our team in Amsterdam! The FP&A team is expanding this year and already includes an ex- Pigment solution architect and another data analyst which will actively work alongside you.This is a key role at the intersection of finance, data, and systems, and will help us predict the future with confidence. We are scaling our use of the Pigment to raise the bar on data quality, automation, and scalable forecasting across all of Finance functions. About AdyenAdyen provides payments, data, and financial products in a single solution for customers like Meta, Uber, H&M, and Microsoft - making us the financial technology platform of choice. At Adyen, everything we do is engineered for ambition. What you’ll doOwn Pigment for P&L / Balance Sheet / Cash Flow: build, maintain, and improve the core models, structures, and drivers used by FP&A and Finance. Fix data at the root: identify recurring issues in Pigment
Hi All! My name is Aastha and I’m a Manager on our FP&A team at Discord! We currently have a new role that just opened up on our team supporting our R&D Org! Given this team's unique position in the company, you will help establish coordination and communication between various teams, such as Engineering, Product Management, Finance and Accounting, and our Talent teams. With these teams, you will drive our planning and forecasting process, ensuring that both are aligned with our longer-term strategic and financial aspirations. In addition, you will gain invaluable experience that offers autonomy, deep interactions with business partners, and the opportunity to impact a rapidly growing business.https://discord.com/jobs/8335879002
Hi,I want to compare the data coming from 2 differents versions (Actual and Budget 2026) and scenarios (Base case and Snapshot 11-12- 2026):1)First version and scenario: Actual - Base case2)Second version and scenario Budget 2026- Snapshot 11-12- 2026How can do it so i can display these 2 columns (1) and 2)) instead of the 4 different columns below ?In addition, how can i compare the 1) and 2) in a calculated item ? Currently i don’t see the option to select a snapshot in a calculated item. Thanks for your help
Hello,For some reason I cannot enter a product idea, so that's why I start this topic as a conversation.It would be nice if there was the option to control the points labels in line charts. Now you can only toggle all the points labels on or off for all datapoints. I would like to have the opportunity to control which points labels I want to see. For example, I only want to see the points labels for line X, but not line Y and Z. Or I only want to see the points labels for the last datapoint instead of all of them. To be able to control the points labels makes the charts more easy on the eyes. Especially when they are presented in a powerpoint.Thanks!
The first time I pulled data from Pigment into Excel, everything worked correctly and the data loaded. However, when I tried to pull the same dataset again using the same filters, I received an error saying: “The view is too big to be displayed.”How can I resolve this issue?
Hi all, Before Pigment, when we used to run on our planning on spreadsheets, if an investor wanted to see how our model worked, we could make a version of ur planning model spreadsheet, which we could share with them and they could then get one of their analysts to dig down into the spreadsheet modelling to see how it worked for themselves... … but, having fully migrated from spreadsheet modelling to Pigment, what do we do now,?Assuming the investor has no prior knowledge of how Pigment works, we can’t just give them access and tell them to take a look for themselves, like we used to do with spreadsheets. So, I am interested to know, what do people do in this situation? What do you give them to look at to demonstrate the model works? Or is it that they can no longer look for themselves and must rely on guided tours/demo from us, instead?
Hi Community,I’m trying to set up an automation that sends a snapshot of our Headcount by Country MoM metric, and I have two specific requirements: Dynamic Data: the report needs to contain data only for the last closed month. Format: it needs to be sent in PDF or as an image. External Recipients: I’d this email to go to people who do not have a Pigment license/account. Any guidance on whether this is natively supported would be appreciated!Thanks!Andy
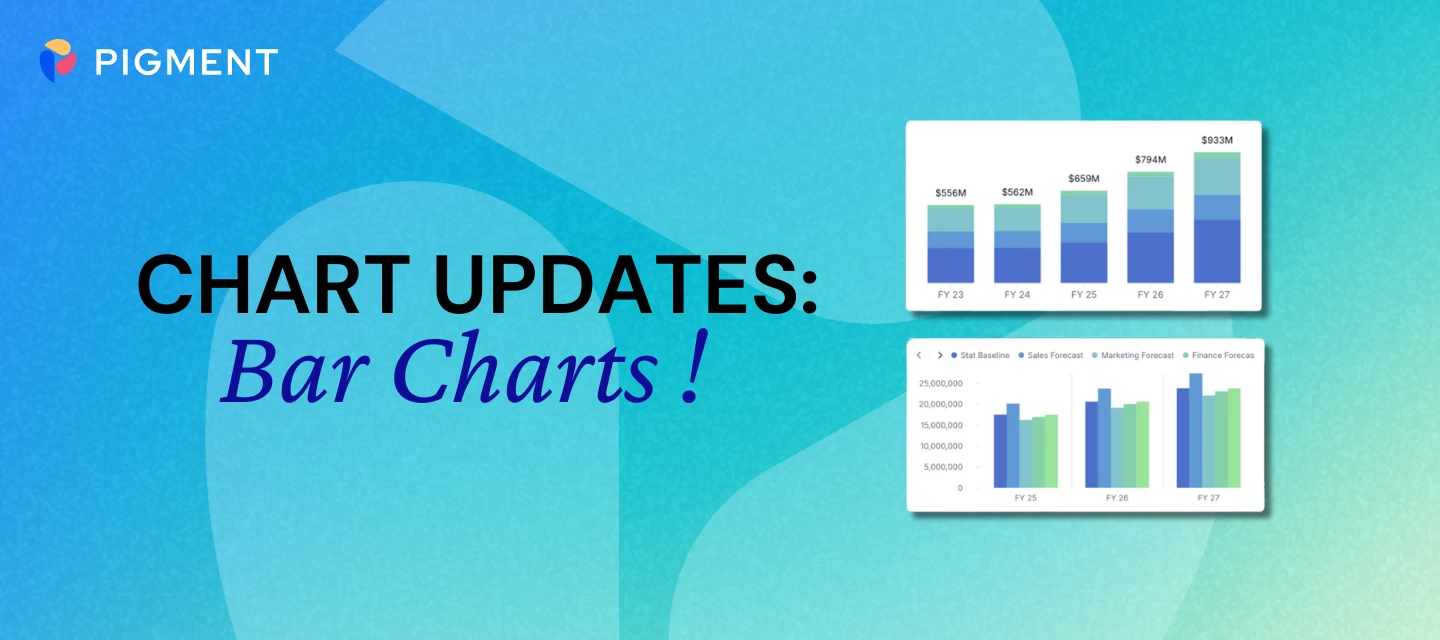
We are thrilled to announce a major step forward in how you visualize your data. We are progressively improving chart clarity and readability across our entire platform to ensure your insights are sharper than ever. The Journey Begins with Bar ChartsStarting in late January 2026, we are rolling out significant enhancements specifically for Bar charts. While your existing color palettes, layouts, and formatting will remain exactly as you like them, you will notice a cleaner, more intuitive feel to your visualizations. What’s Changing?We’ve focused on three core areas to improve your experience:Improved Readability: Labels and legends are now clearer with cleaner spacing. Grid lines have been added to appear between bars, making data much easier to digest at a glance. Optimized Layouts: We’ve redesigned the widget layout to give the charts themselves more room, maximizing the visibility of your data. Richer Interactions: Scrollable Legends: No more lost information! Legends contain
Hi - It would be great to have the ability to publish messages or announcements that are automatically sent to all active internal Pigment users.For example, when actuals are updated, we’d like to notify users so they can log in and review the latest numbers.We have more than 100 users, and today this requires sending multiple Slack messages just to make people aware.Thanks!
Hi - the new feature whereby hints are offered directly in the formula bar are a little confusing. In the above are they simply highlighting where I have used ‘BY’ modifier and explaining what is happening or does the formula need to be updated? Prior to today my goal with the formulas is to minimise any text here and I am not sure if this is highlight an error or not as the formulas look good.Thanks
For the purpose of versioning, we are using a combination of methods for different use cases. This would include scenarios (incl snapshots), publishing and cloning. We have instances where we may need to edit a formula in LIVE but leave the locked forecast as is. In order to do we, we enable “add formulas for scenarios”. I noticed that formulas are editable even in locked scenarios. How can I make sure that if a scenario is locked, NO ONE, including admins, can edit it? Leaving this edit option open for locked scenarios can have unintended changes.
Amazing opportunity to join an amazing team. As a Sales Performance Management Application Developer on the Sales Automation Engineering team, you will serve as the bridge between technical implementation and strategic sales operations. You will be responsible for gathering and documenting business requirements, designing, building, testing, deploying, and providing post-production support on complex, high-impact cross-functional systems. These projects directly deliver value to our Commercial and Sales Operations teams.Apply Here!
HiI have a target metric containing a subset. This dimension is a subset of a list present in a source metric. When I reference the source metric the data does not allocate over the subset list items as I would expect. Do I need to map the complete list into the subset? Instinctively this seems irrelevant as they are effectively the same list so dimensionality is comparable. This is my source metric - This is my target metric - PL3_Overheads is a subset of PL3
I am trying to export pigment data to PowerBI following the guided steps available on community, but I get an error “404 id not found”. Does anyone know what I could be missing in the setup? I used payload functionality to generate ID for metrics.
I have set up a table with a few metrics in with either of the following two setups:1) Dimensioned by Company and Department2) Dimensions by EmployeeThe employee dimension has properties using the Company and Department dimensions.In my table i can either add the direct Company and Department dimensions to my pages or the mapped versions from Employee.However, if I select the direct dimensions in the Pages, the Employee metric (2) doesn’t filter properly. And the same happens to metric (1) dimensioned by company and department if I select the mapped dimensions in the pages.How can i get it so that my table filters both properly?
Introduction:Hello Pigmenteers! I’m Bas van der Laan (@Bas in the community), and I have been working at HEMA for almost three years now. HEMA is a Dutch retail organization, mainly based in the Netherlands, with a presence in Belgium and France. We focus on apparel, gifts, and everyday essentials.I work in FP&A, where my role is to coordinate the overall budgeting and forecasting processes across the company. Rather than focusing on a single business unit, I oversee that everything runs smoothly, timelines are met, and we deliver a strong, cohesive budget. You can see Bas’s full interview here: Can you tell us a bit about your career journey and how you ended up in finance?I didn’t actually study finance - my background is in logistics. After university, I worked in logistics and project management for several years before realizing I wanted to shift from focusing on volumes to focusing on financial performance.I moved into a business control role for the logistics department of
Hi Is there a way to Create Automated task which deletes user inputs in bulk when trigger is met. I’d like to set it up in a way, than when Month becomes from Forecast to Actual, it would delete the new Actual month user inputs which were so far meant for Forecast, but Actual month value should come from formula. I know how to set up task to notify, once this month changes and also how to set up one-time bulk deletion, when Month becomes Actual, but is there a possibility to combine these to so I could stop being middle-man? Best regardsOtt
Hi everybody, Could someone help me understand why the “type fees” dimension was not updated, even though I selected “delete all items” for my transaction during the load from the Azure SQL table?Many thanks,
Already have an account? Login
Single Sign-On Need help?
Enter your E-mail address. We'll send you an e-mail with instructions to reset your password.